| Fire incidents reported |
|---|
| Sreet name | Count |
|---|
| 193RD PL | 8 | | RIVERSIDE DR. | 8 | | 40 HWY | 6 | | HWY 40 | 6 | | 4350 193RD PLACE | 4 | | 4629 PAMELA DRIVE | 4 | | 64TH ST | 4 | | ALLEN PARK RD | 4 | | BUTLER RD | 4 | | C 40 AND ALLEN PARK RD | 4 | | C40A HWY | 4 | | HWY 19 | 4 | | HWY 40 WEST | 4 | | HWY 40 WEST HWY | 4 | | MAPLE RIDGE RD | 4 | | PALM DR | 4 | | #10 60TH STREET | 2 | | 12 65TH STREET | 2 | | 127 CT | 2 | | 180 ST | 2 | | 193 PL | 2 | | 20 55TH ST | 2 | | 21 62ND STREET | 2 | | 30 MAGNOLIA AVE. | 2 | | 326 | 2 |
| | | Fire incidents reported |
|---|
| Sreet name | Count |
|---|
| 40 WEST AND 59TH STREET | 2 | | 40 WEST HWY | 2 | | 4150 & C40A | 2 | | 46 PAMELA DRIVE | 2 | | 4601 PAMELA DRIVE | 2 | | 4800 RIVERSIDE DR | 2 | | 5 NANCY PARKWAY | 2 | | 5011 SE 193RD PLACE | 2 | | 50TH ST | 2 | | 53RD ST | 2 | | 55 MAGNOLIA AVENUE | 2 | | 55TH ST | 2 | | 56TH ST | 2 | | 5850 RIVERSIDE DRI VE | 2 | | 59TH ST | 2 | | 60 TH ST | 2 | | 60TH ST | 2 | | 60TH ST AT HARMONY LA | 2 | | 60TH STREET | 2 | | 6106 HIGHWAY 40 WEST | 2 | | 6113 RIVERSIDE DR | 2 | | 61ST ST. AND HARMONY LN | 2 | | 6200 BLOCK OF RIVERSIDE DRIVE | 2 | | 62ND AND KNOTTS WAY | 2 | | |
|
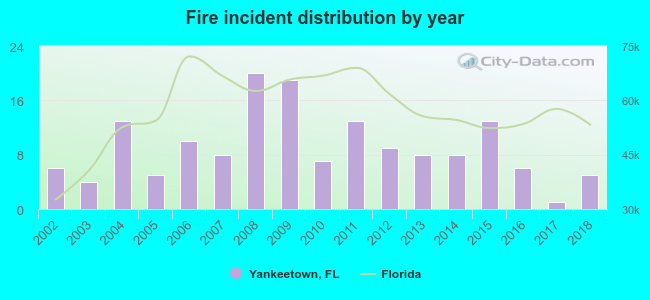 Based on the data from the years 2002 - 2018 the average number of fires per year is 9. The highest number of fire incidents - 20 took place in 2008, and the least - 1 in 2017. The data has a decreasing trend.
 32.9% incidents where reported in the morning and 67.1% in the evening. The most fires (18.1%) took place on Monday, and the least (9.0%) on Sunday.
 Based on the 155 fire incident reports from years 2002 - 2018 most fires (18.7%) took place during May, and the least (3.2%) in February.
 Out of all 641 cases reported during the years 2002 - 2018, the most belonged to the categories: Overpressure Rupture (48.4%), Fire (24.2%), and Rescue & EMS (18.6%).
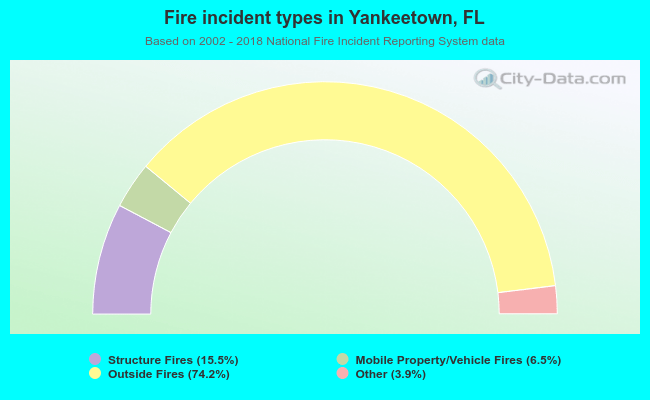 When looking into fire subcategories, the most reports belonged to: Outside Fires (74.2%), and Structure Fires (15.5%).