Yalaha: Fire Incidents, Florida (FL)
Where are fire incidents reported in Yalaha, FL
Something went wrong! Please refresh the page.
|
| |||||||||||||||||||||||||||||||||||||||||||||||||||||||||||||||||||||||||||||||||||||||||||||||||||||||||||||
2002 - 2018 National Fire Incident Reporting System (NFIRS) incidents
- Incident types reported to NFIRS in Yalaha, FL
- 50858.6%Rescue & EMS
- 11413.1%Fire
- 778.9%Hazardous Condition
- 708.1%Good Intent Call
- 687.8%Service Call
- 222.5%False Alarm
- 50.6%Special Incident
- 30.3%Severe Weather
- Fire incident types reported to NFIRS in Yalaha, FL
- 7364.0%Outside Fires
- 2017.5%Structure Fires
- 1815.8%Mobile Property/Vehicle Fires
- 32.6%Other
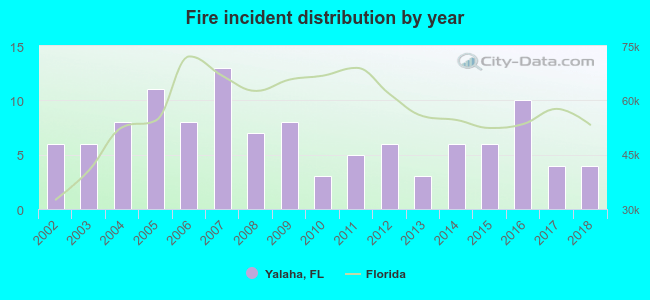 Based on the data from the years 2002 - 2018 the average number of fires per year is 7. The highest number of fire incidents - 13 took place in 2007, and the least - 3 in 2010. The data has a decreasing trend.
 22.8% incidents where reported in the morning and 77.2% in the evening. The most fires (21.9%) took place on Wednesday, and the least (7.9%) on Thursday.
 Based on the 114 fire incident reports from years 2002 - 2018 most fires (14.9%) took place during May, and the least (4.4%) in July.
 Out of all 867 cases reported during the years 2002 - 2018, the most belonged to the categories: Overpressure Rupture (58.6%), Fire (13.1%), and Rescue & EMS (8.9%).
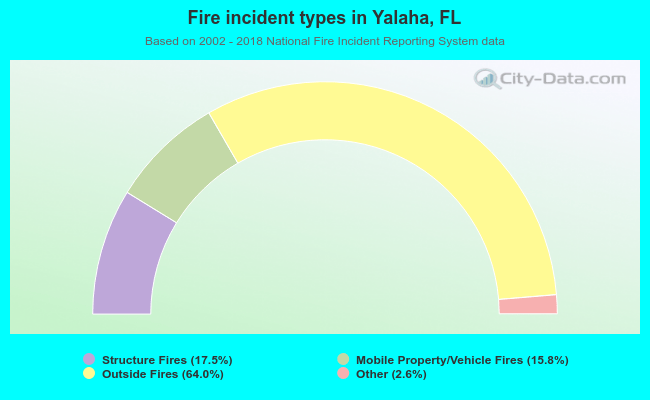 When looking into fire subcategories, the most reports belonged to: Outside Fires (64.0%), and Structure Fires (17.5%).