Wyoming: Fire Incidents, Minnesota (MN)
Where are fire incidents reported in Wyoming, MN
Something went wrong! Please refresh the page.
|
| |||||||||||||||||||||||||||||||||||||||||||||||||||||||||||||||||||||||||||||||||||||||||||||||||||||||||||||
2002 - 2018 National Fire Incident Reporting System (NFIRS) incidents
- Incident types reported to NFIRS in Wyoming, MN
- 1,03847.1%Rescue & EMS
- 51623.4%Fire
- 26311.9%Hazardous Condition
- 25611.6%Good Intent Call
- 632.9%Service Call
- 602.7%False Alarm
- 50.2%Severe Weather
- Fire incident types reported to NFIRS in Wyoming, MN
- 21040.7%Structure Fires
- 17233.3%Outside Fires
- 10119.6%Mobile Property/Vehicle Fires
- 336.4%Other
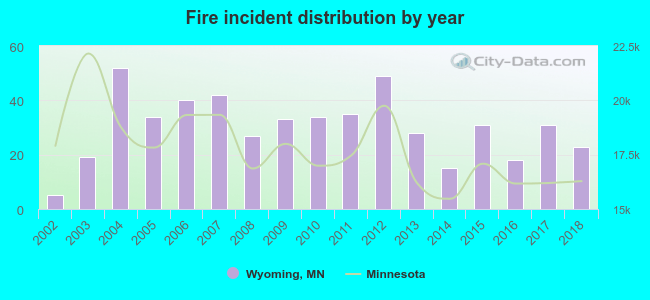 According to the data from the years 2002 - 2018 the average number of fire incidents per year is 30. The highest number of fires - 52 took place in 2004, and the least - 5 in 2002. The data has an increasing trend.
The average number of yearly fire incidents per 10k residents in Wyoming, MN compared to nearest cities:
(Note: Based on data for the last 3 years, including only cities with population 5,000 and above)
| Wyoming: | 30.8 |
| Forest Lake: | 20.8 |
| East Bethel: | 35.8 |
| Ham Lake: | 25.2 |
| North Branch: | 42.0 |
| Lino Lakes: | 20.4 |
| Hugo: | 19.2 |
| Isanti: | 54.7 |
| Oak Grove: | 36.8 |
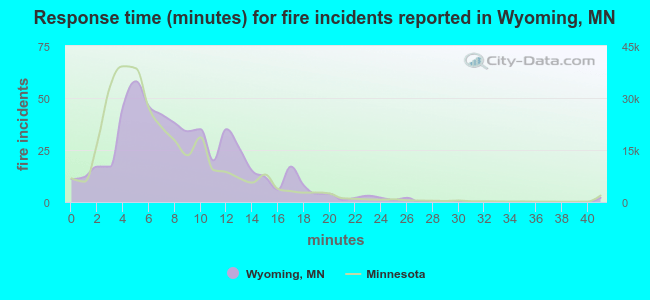 The median response time based on all reported fire incidents is 8 minutes. This is higher than the Minnesota median value.
The median response time in Wyoming, MN compared to nearest cities:
(Note: Based on data for all years, including only cities with at least 500 fire incidents)
| Wyoming: | 8 minutes |
| Forest Lake: | 8 minutes |
| Stacy: | 8 minutes |
| East Bethel: | 10 minutes |
| Ham Lake: | 7 minutes |
| North Branch: | 9 minutes |
| Lino Lakes: | 7 minutes |
| Hugo: | 9 minutes |
| Isanti: | 8 minutes |
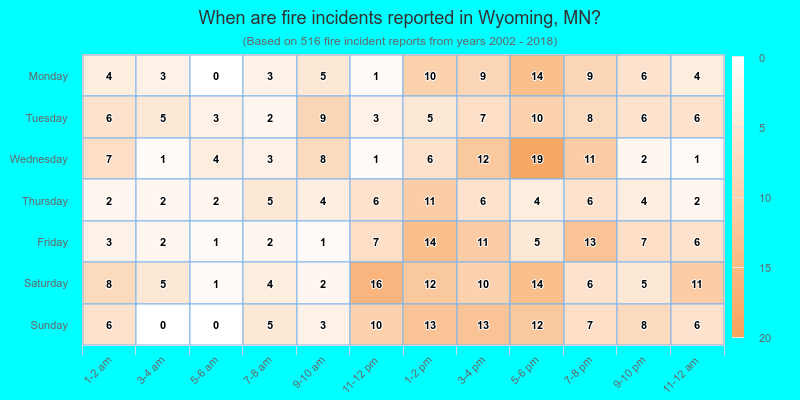
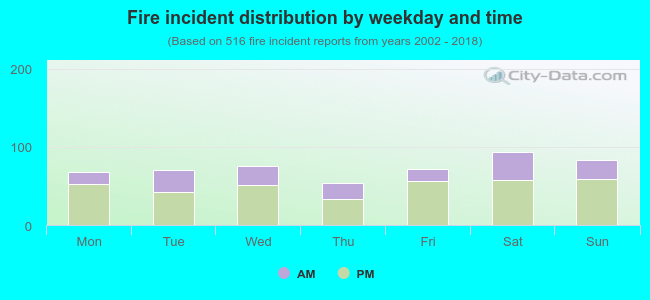 32.0% incidents where reported in the morning and 68.0% in the evening. The most fires (18.2%) took place on Saturday, and the least (10.5%) on Thursday.
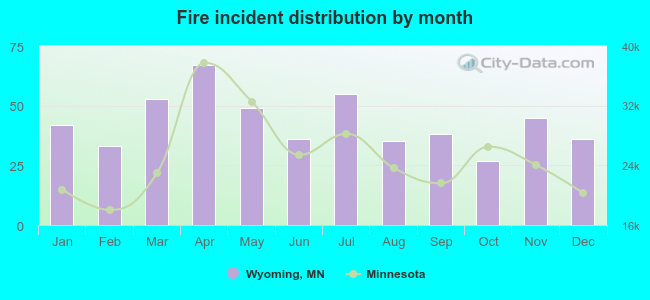 Based on the 516 incident reports from years 2002 - 2018 most fires (13.0%) took place during April, and the least (5.2%) in October.
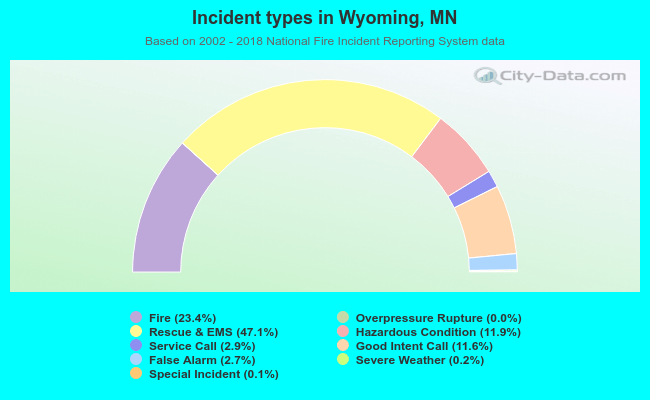 Out of all 2,204 cases reported during the years 2002 - 2018, the most belonged to the categories: Rescue & EMS (47.1%), Fire (23.4%), and Hazardous Condition (11.9%).
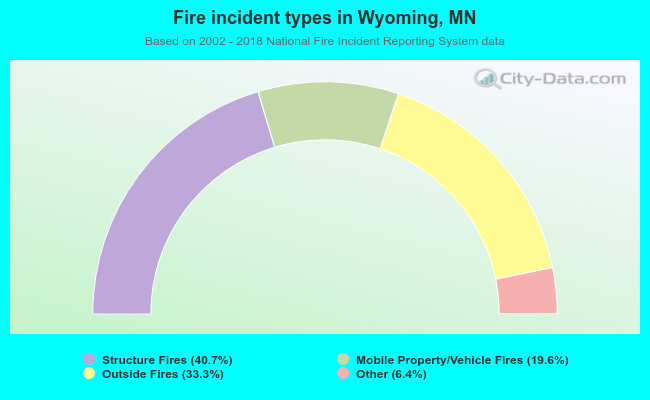 When looking into fire subcategories, the most incidents belonged to: Structure Fires (40.7%), and Outside Fires (33.3%).