Wymore: Fire Incidents, Nebraska (NE)
Where are fire incidents reported in Wymore, NE
Something went wrong! Please refresh the page.
|
| |||||||||||||||||||||||||||||||||||||||||||||||||||||||||||||||||||||||||||||||||||||||||||||||||||||||||||||
2002 - 2018 National Fire Incident Reporting System (NFIRS) incidents
- Incident types reported to NFIRS in Wymore, NE
- 20045.4%Rescue & EMS
- 13029.5%Fire
- 8920.2%Good Intent Call
- 112.5%Hazardous Condition
- 61.4%False Alarm
- 40.9%Service Call
- 10.2%Special Incident
- Fire incident types reported to NFIRS in Wymore, NE
- 6348.5%Outside Fires
- 4232.3%Structure Fires
- 1310.0%Other
- 129.2%Mobile Property/Vehicle Fires
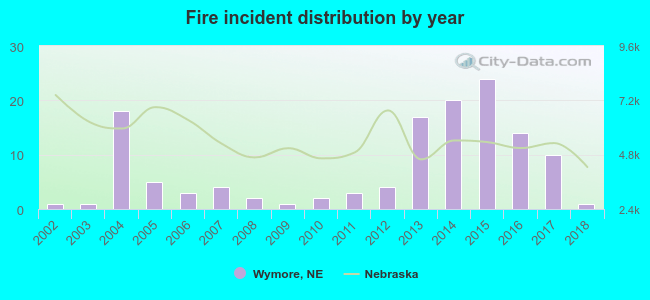 According to the data from the years 2002 - 2018 the average number of fires per year is 8. The highest number of reported fire incidents - 24 took place in 2015, and the least - 1 in 2002. The data has a constant trend.
 24.6% incidents where reported in the morning and 75.4% in the evening. The most fires (20.0%) took place on Saturday, and the least (10.0%) on Wednesday.
 Based on the 130 incident reports from years 2002 - 2018 most fires (17.7%) took place during March, and the least (2.3%) in May.
 Out of all 441 cases reported during the years 2002 - 2018, the most belonged to the categories: Overpressure Rupture (45.4%), Fire (29.5%), and Service Call (20.2%).
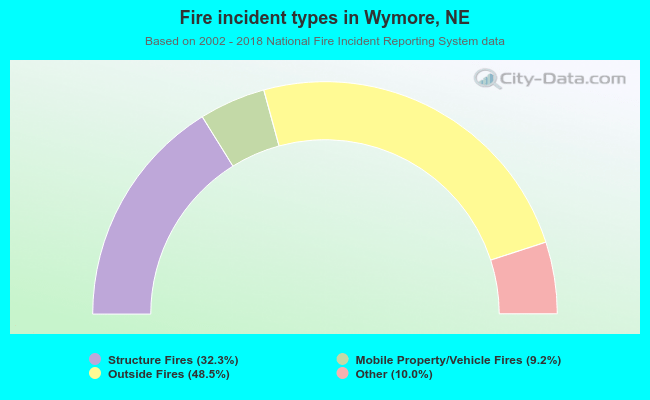 When looking into fire subcategories, the most reports belonged to: Outside Fires (48.5%), and Structure Fires (32.3%).