Wyanet: Fire Incidents, Illinois (IL)
Where are fire incidents reported in Wyanet, IL
Something went wrong! Please refresh the page.
|
| |||||||||||||||||||||||||||||||||||||||||||||||||||||||||||||||||||||||||||||||||||||||||||||||||||||||||||||
2004 - 2018 National Fire Incident Reporting System (NFIRS) incidents
- Incident types reported to NFIRS in Wyanet, IL
- 13148.3%Fire
- 9735.8%Rescue & EMS
- 3211.8%Hazardous Condition
- 72.6%Good Intent Call
- 31.1%Service Call
- 10.4%Special Incident
- Fire incident types reported to NFIRS in Wyanet, IL
- 6549.6%Outside Fires
- 4635.1%Structure Fires
- 1813.7%Mobile Property/Vehicle Fires
- 21.5%Other
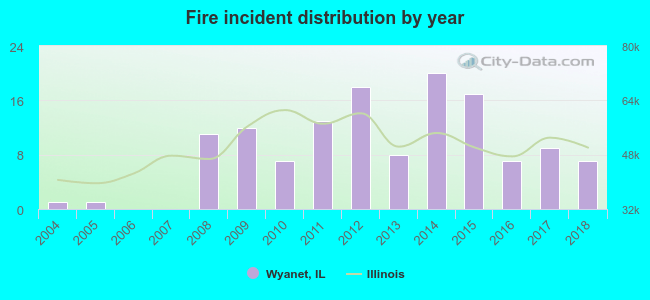 According to the data from the years 2004 - 2018 the average number of fire incidents per year is 9. The highest number of fires - 20 took place in 2014, and the least - 0 in 2006. The data has a growing trend.
 25.2% incidents where reported in the morning and 74.8% in the evening. The most fires (22.1%) took place on Wednesday, and the least (7.6%) on Friday.
 According to the 131 incident reports from years 2004 - 2018 most fires (17.6%) took place during April, and the least (0.8%) in January.
 Out of all 271 cases reported during the years 2004 - 2018, the most belonged to the categories: Fire (48.3%), Overpressure Rupture (35.8%), and Rescue & EMS (11.8%).
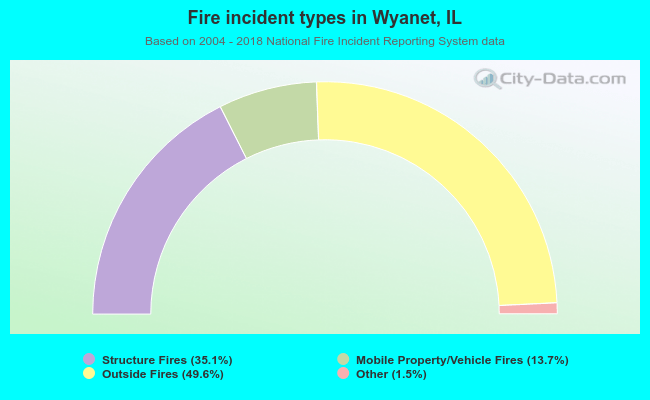 When looking into fire subcategories, the most incidents belonged to: Outside Fires (49.6%), and Structure Fires (35.1%).