Wrightsville: Fire Incidents, Pennsylvania (PA)
Where are fire incidents reported in Wrightsville, PA
Something went wrong! Please refresh the page.
|
| |||||||||||||||||||||||||||||||||||||||||||||||||||||||||||||||||||||||||||||||||||||||||||||||||||||||||||||
2003 - 2018 National Fire Incident Reporting System (NFIRS) incidents
- Incident types reported to NFIRS in Wrightsville, PA
- 65932.4%Fire
- 44822.0%Hazardous Condition
- 35417.4%Rescue & EMS
- 22210.9%Service Call
- 1698.3%Good Intent Call
- 944.6%False Alarm
- 572.8%Severe Weather
- 271.3%Special Incident
- 30.1%Overpressure Rupture
- Fire incident types reported to NFIRS in Wrightsville, PA
- 43566.0%Structure Fires
- 11918.1%Outside Fires
- 6910.5%Other
- 365.5%Mobile Property/Vehicle Fires
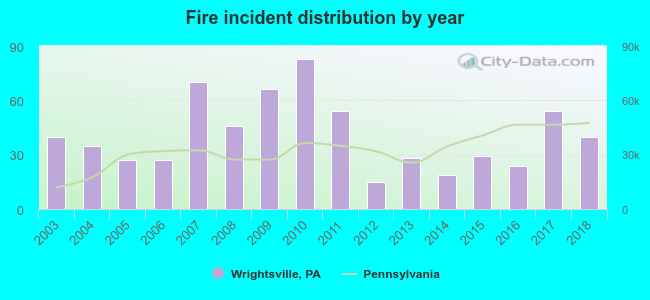 According to the data from the years 2003 - 2018 the average number of fire incidents per year is 41. The highest number of reported fires - 83 took place in 2010, and the least - 15 in 2012. The data has a constant trend.
 The median response time based on all reported fire incidents is 9 minutes. This is higher than the state median value.
The median response time in Wrightsville, PA compared to nearest cities:
(Note: Based on data for all years, including only cities with at least 500 fire incidents)
| Wrightsville: | 9 minutes |
| Columbia: | 6 minutes |
| Marietta: | 8 minutes |
| Mount Joy: | 8 minutes |
| Landisville: | 9 minutes |
| Red Lion: | 8 minutes |
| Millersville: | 8 minutes |
| Elizabethtown: | 9 minutes |
| Manchester: | 8 minutes |
 36.6% incidents where reported in the morning and 63.4% in the evening. The most fires (18.8%) took place on Friday, and the least (10.2%) on Thursday.
 Based on the 659 reports from years 2003 - 2018 most fires (12.7%) took place during February, and the least (5.8%) in October.
 Out of all 2,033 cases reported during the years 2003 - 2018, the most belonged to the categories: Fire (32.4%), Hazardous Condition (22.0%), and Rescue & EMS (17.4%).
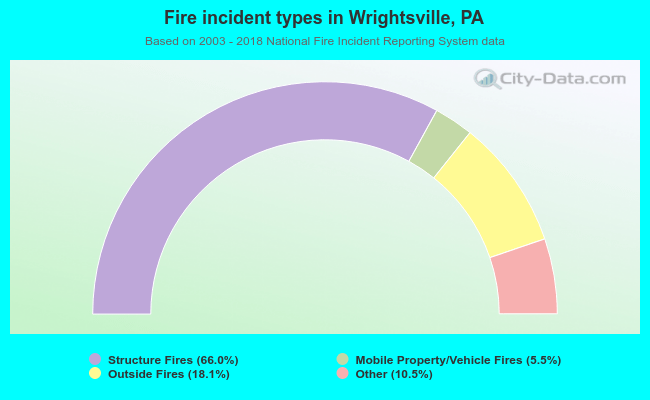 When looking into fire subcategories, the most incidents belonged to: Structure Fires (66.0%), and Outside Fires (18.1%).