Wrightsville Beach: Fire Incidents, North Carolina (NC)
Where are fire incidents reported in Wrightsville Beach, NC
Something went wrong! Please refresh the page.
|
| |||||||||||||||||||||||||||||||||||||||||||||||||||||||||||||||||||||||||||||||||||||||||||||||||||||||||||||
2004 - 2018 National Fire Incident Reporting System (NFIRS) incidents
- Incident types reported to NFIRS in Wrightsville Beach, NC
- 1,42956.1%Rescue & EMS
- 32712.8%False Alarm
- 30612.0%Hazardous Condition
- 2027.9%Fire
- 1756.9%Good Intent Call
- 963.8%Service Call
- 40.2%Overpressure Rupture
- 40.2%Special Incident
- Fire incident types reported to NFIRS in Wrightsville Beach, NC
- 8441.6%Outside Fires
- 8039.6%Structure Fires
- 209.9%Other
- 188.9%Mobile Property/Vehicle Fires
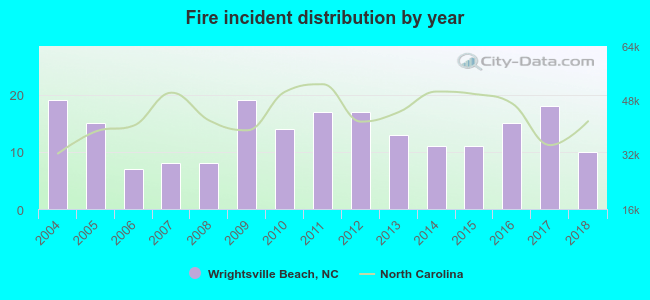 According to the data from the years 2004 - 2018 the average number of fires per year is 13. The highest number of reported fire incidents - 19 took place in 2004, and the least - 7 in 2006. The data has a decreasing trend.
 28.7% incidents where reported in the morning and 71.3% in the evening. The most fires (16.3%) took place on Monday, and the least (11.9%) on Friday.
 Based on the 202 reports from years 2004 - 2018 most fires (19.3%) took place during July, and the least (3.0%) in December.
 Out of all 2,545 cases reported during the years 2004 - 2018, the most belonged to the categories: Rescue & EMS (56.1%), False Alarm (12.8%), and Hazardous Condition (12.0%).
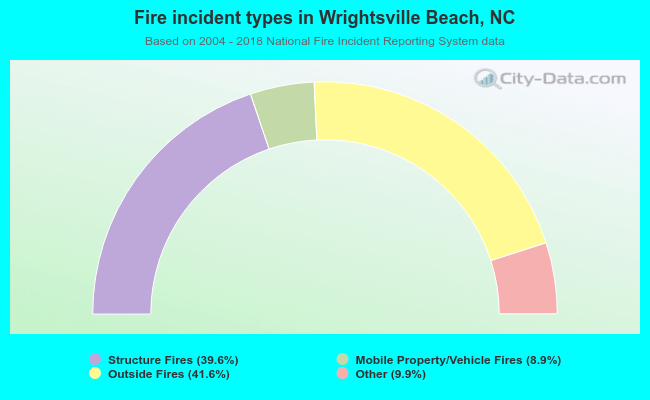 When looking into fire subcategories, the most reports belonged to: Outside Fires (41.6%), and Structure Fires (39.6%).