Woodstock: Fire Incidents, Illinois (IL)
Where are fire incidents reported in Woodstock, IL
Something went wrong! Please refresh the page.
| Fire incidents reported | |
|---|---|
| Sreet name | Count |
| EASTWOOD DR | 108 |
| SOUTH ST | 102 |
| ROUTE 14 HWY | 86 |
| ROUTE 47 HWY | 72 |
| WASHINGTON ST | 72 |
| LAKE AVE | 64 |
| DEAN ST | 62 |
| LAKE SHORE DR | 62 |
| COUNTRY CLUB RD | 58 |
| CHARLES RD | 52 |
| SEMINARY AVE | 46 |
| GREENWOOD RD | 44 |
| LEAH LANE | 44 |
| LUCAS RD | 44 |
| ROUTE 120 HWY | 42 |
| CALHOUN ST | 40 |
| MCHENRY AVE | 38 |
| CLAY ST | 34 |
| DOTY RD | 34 |
| MCCONNELL RD | 34 |
| STONELAKE RD | 34 |
| WHEELER ST | 32 |
| QUEENE ANNE RD | 30 |
| RAFFEL RD | 30 |
| PLEASANT VALLEY RD | 28 |
| WILLOW BROOKE DR | 28 |
| DAVIS RD | 26 |
| HUGHES RD | 26 |
| JACKSON ST | 26 |
| FRANKLINVILLE RD | 24 |
| Other | 389 |
2002 - 2018 National Fire Incident Reporting System (NFIRS) incidents
- Incident types reported to NFIRS in Woodstock, IL
- 17,37465.8%Rescue & EMS
- 2,5799.8%Hazardous Condition
- 2,3138.8%False Alarm
- 1,8116.9%Fire
- 1,5836.0%Service Call
- 6812.6%Good Intent Call
- Fire incident types reported to NFIRS in Woodstock, IL
- 78443.3%Structure Fires
- 77342.7%Outside Fires
- 23312.9%Mobile Property/Vehicle Fires
- 211.2%Other
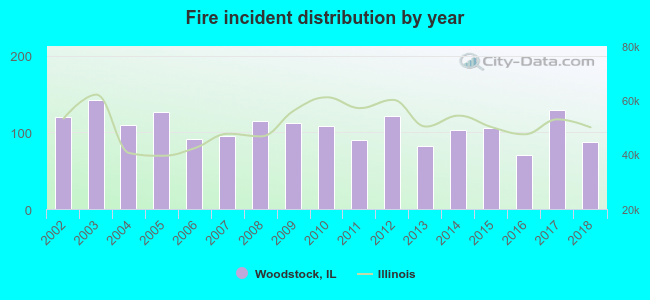 According to the data from the years 2002 - 2018 the average number of fire incidents per year is 107. The highest number of fire incidents - 142 took place in 2003, and the least - 70 in 2016. The data has a dropping trend.
The average number of yearly fire incidents per 10k residents in Woodstock, IL compared to nearest cities:
(Note: Based on data for the last 3 years, including only cities with population 5,000 and above)
| Woodstock: | 38.0 |
| Wonder Lake: | 37.5 |
| Crystal Lake: | 24.9 |
| McHenry: | 43.8 |
| Marengo: | 57.3 |
| Lake in the Hills: | 10.8 |
| Huntley: | 21.0 |
| Harvard: | 53.8 |
| Johnsburg: | 24.4 |
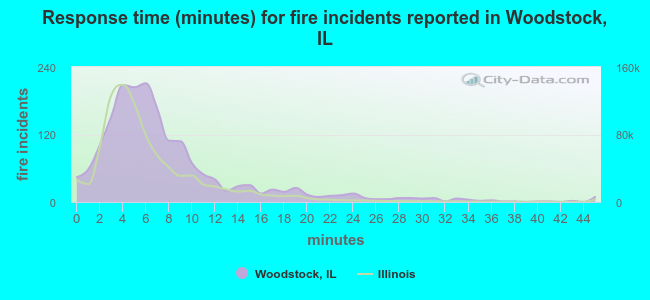 The median response time based on all reported fire incidents is 6 minutes. This is about the same as the Illinois median value.
The median response time in Woodstock, IL compared to nearest cities:
(Note: Based on data for all years, including only cities with at least 500 fire incidents)
| Woodstock: | 6 minutes |
| Wonder Lake: | 7 minutes |
| Crystal Lake: | 6 minutes |
| McHenry: | 5 minutes |
| Marengo: | 8 minutes |
| Lake in the Hills: | 5 minutes |
| Huntley: | 7 minutes |
| Harvard: | 9 minutes |
| Cary: | 5 minutes |
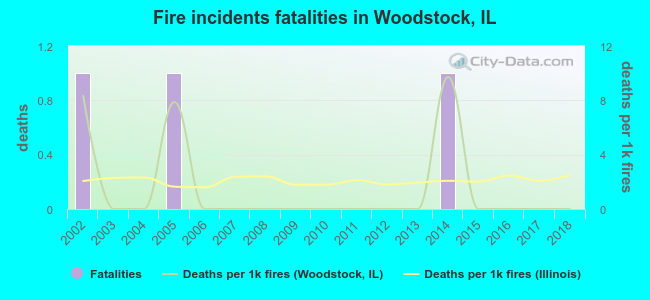 Based on the reports from the years 2002 - 2018 the average number of fire-related yearly deaths is 0. The highest number of deaths - 1 took place in 2002, and the lowest - 0 in 2003. The data has a declining trend.
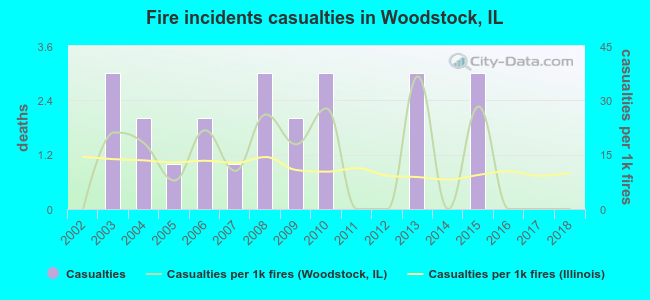 Based on the reports from the years 2002 - 2018 the average number of fire-related casualties per year is 1. The highest number of reported casualties - 3 took place in 2003, and the lowest - 0 in 2002. The data has a constant trend.
The average number of casualties per 1,000 fires is 13. This indicator was the highest - 37 in 2013, and the lowest 0 in 2002. The trend for casualties per 1,000 fires is constant. Compared to the Illinois value the number of injuries per 1,000 fires is about the same.
Based on the reports from the years 2002 - 2018 the average number of fire-related casualties per year is 1. The highest number of reported casualties - 3 took place in 2003, and the lowest - 0 in 2002. The data has a constant trend.
The average number of casualties per 1,000 fires is 13. This indicator was the highest - 37 in 2013, and the lowest 0 in 2002. The trend for casualties per 1,000 fires is constant. Compared to the Illinois value the number of injuries per 1,000 fires is about the same.Casualties per 1,000 incidents in Woodstock, IL compared to nearest cities:
(Note: Based on data for all years, including only cities with at least 500 fire incidents)
| Woodstock: | 12.7 |
| Wonder Lake: | 0.0 |
| Crystal Lake: | 9.7 |
| McHenry: | 23.6 |
| Marengo: | 0.0 |
| Lake in the Hills: | 6.1 |
| Huntley: | 1.9 |
| Harvard: | 12.4 |
| Cary: | 1.4 |
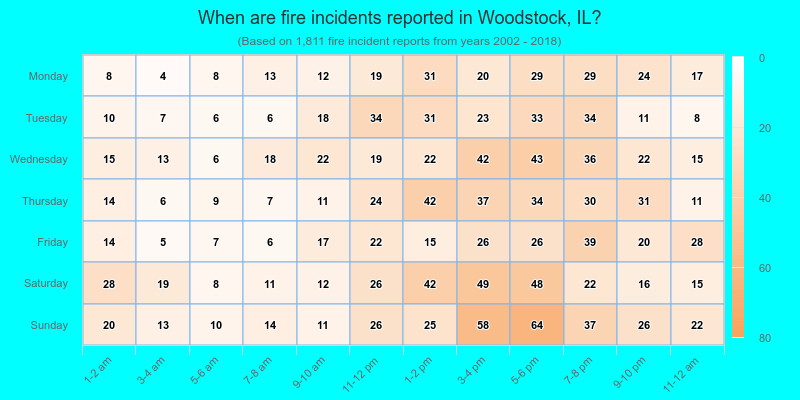
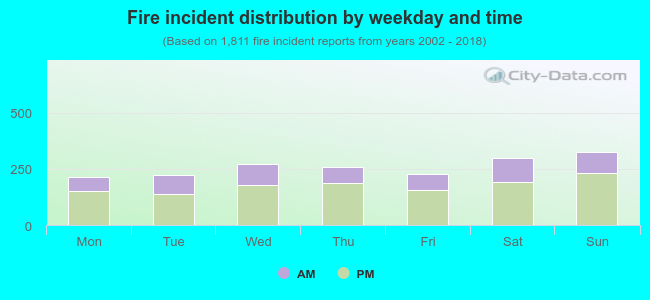 31.9% incidents where reported in the morning and 68.1% in the evening. The most fires (18.0%) took place on Sunday, and the least (11.8%) on Monday.
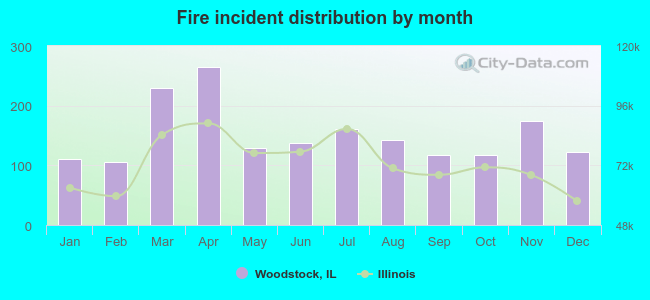 Based on the 1,811 fires from years 2002 - 2018 most fires (14.6%) took place during April, and the least (5.8%) in February.
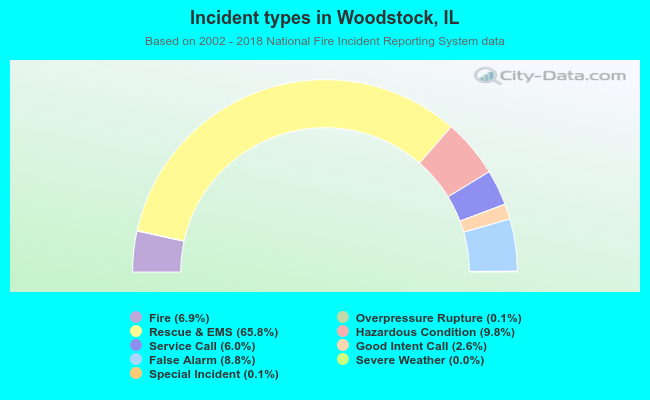 Out of all 26,390 cases reported during the years 2002 - 2018, the most belonged to the categories: Rescue & EMS (65.8%), Hazardous Condition (9.8%), and False Alarm (8.8%).
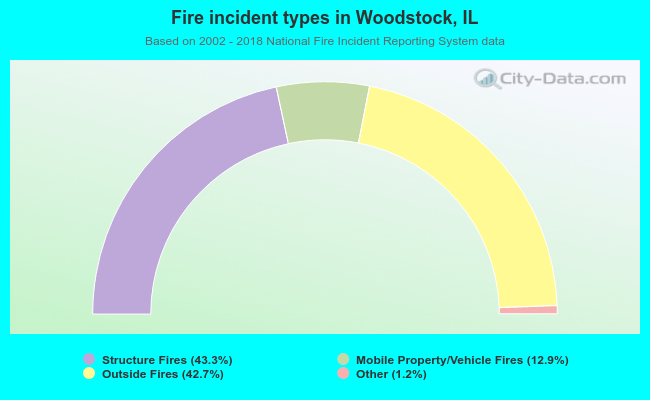 When looking into fire subcategories, the most reports belonged to: Structure Fires (43.3%), and Outside Fires (42.7%).