| Fire incidents reported |
|---|
| Sreet name | Count |
|---|
| MAIN ST | 108 | | WOODSBORO RD | 66 | | CREAGERSTOWN RD | 64 | | DUBLIN RD | 64 | | COPPERMINE RD | 58 | | SECOND ST | 50 | | OAK HILL RD | 40 | | RENNER RD | 40 | | ADAMS CIR | 26 | | WOODSBORO PIKE | 24 | | COUNCIL DR | 22 | | COPPER OAKS CT | 20 | | GRAVEL HILL RD | 20 | | CASH SMITH RD | 18 | | ADAMS ST | 16 | | WHISKEY SPRINGS RD | 16 | | CLYDE YOUNG RD | 12 | | LEGORE RD | 10 | | WOODLAND DR | 10 | | BENNIE DUNCAN RD | 8 | | DUBLIN RD | 8 | | ELIZABETH ST | 8 | | LIBERTY RD | 8 | | BUFFINGTON RD | 6 | | EVELYN DR | 6 |
| | | Fire incidents reported |
|---|
| Sreet name | Count |
|---|
| GEISBERT RD | 6 | | HOFFMAN SEACHRIST RD | 6 | | LEGORE BRIDGE ROAD | 6 | | OAK HILL RD | 6 | | WOODLAND DR | 6 | | CASH SMITH RD | 4 | | COUNCIL ST | 4 | | ETZLER MILL RD | 4 | | GRUBER RD | 4 | | HILL RD | 4 | | HOFFMAN SEACHRIST RD | 4 | | HOFFMAN SEACREST | 4 | | JAMES ST | 4 | | LIBERTY ST | 4 | | OAKHILL RD | 4 | | SCARLET OAK CT | 4 | | WEINBERG CT | 4 | | WOODSBORO RD. | 4 | | WOODSBORO PIKE | 4 | | 625 S.MAIN ST | 2 | | 9903 PINE TREE RD | 2 | | 9906 WOODSBORO RD | 2 | | AREA OF HOFFMAN SEACHREST RD | 2 | | AUTUMN SKY TER | 2 | | |
|
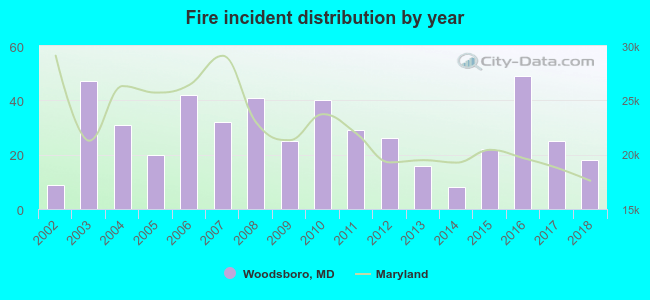 According to the data from the years 2002 - 2018 the average number of fires per year is 28. The highest number of reported fire incidents - 49 took place in 2016, and the least - 8 in 2014. The data has a growing trend.
 38.8% incidents where reported in the morning and 61.3% in the evening. The most fires (20.4%) took place on Tuesday, and the least (11.0%) on Monday.
 Based on the 480 fire incidents from years 2002 - 2018 most fires (13.3%) took place during January, and the least (4.4%) in August.
 Out of all 1,307 cases reported during the years 2002 - 2018, the most belonged to the categories: Fire (36.7%), Rescue & EMS (25.6%), and Good Intent Call (14.9%).
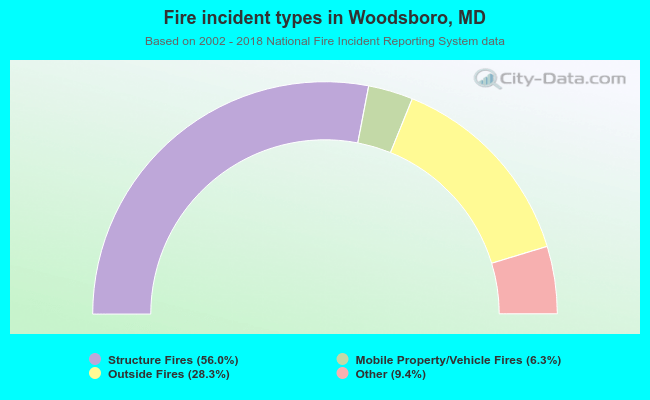 When looking into fire subcategories, the most reports belonged to: Structure Fires (56.0%), and Outside Fires (28.3%).