Woodruff: Fire Incidents, Wisconsin (WI)
Where are fire incidents reported in Woodruff, WI
Something went wrong! Please refresh the page.
|
| |||||||||||||||||||||||||||||||||||||||||||||||||||||||||||||||||||||||||||||||||||||||||||||||||||||||||||||
2003 - 2018 National Fire Incident Reporting System (NFIRS) incidents
- Incident types reported to NFIRS in Woodruff, WI
- 13636.3%Fire
- 6918.4%Rescue & EMS
- 5815.5%Hazardous Condition
- 5715.2%False Alarm
- 4512.0%Good Intent Call
- 71.9%Service Call
- 30.8%Severe Weather
- Fire incident types reported to NFIRS in Woodruff, WI
- 9670.6%Structure Fires
- 2619.1%Outside Fires
- 107.4%Mobile Property/Vehicle Fires
- 42.9%Other
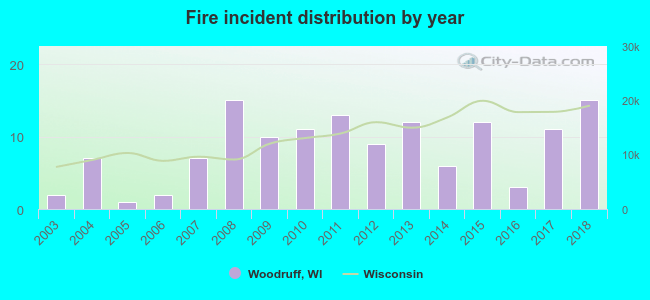 Based on the data from the years 2003 - 2018 the average number of fires per year is 9. The highest number of reported fire incidents - 15 took place in 2008, and the least - 1 in 2005. The data has a growing trend.
 35.3% incidents where reported in the morning and 64.7% in the evening. The most fires (19.9%) took place on Monday, and the least (8.8%) on Tuesday.
 According to the 136 incident reports from years 2003 - 2018 most fires (18.4%) took place during January, and the least (3.7%) in September.
 Out of all 375 cases reported during the years 2003 - 2018, the most belonged to the categories: Fire (36.3%), Overpressure Rupture (18.4%), and Rescue & EMS (15.5%).
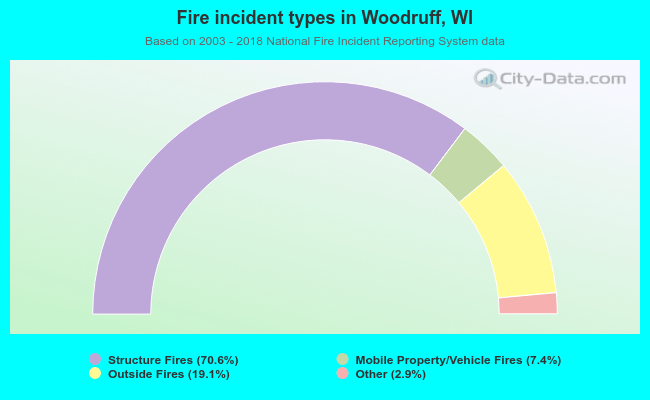 When looking into fire subcategories, the most incidents belonged to: Structure Fires (70.6%), and Outside Fires (19.1%).