Wolfe City: Fire Incidents, Texas (TX)
Where are fire incidents reported in Wolfe City, TX
Something went wrong! Please refresh the page.
|
| |||||||||||||||||||||||||||||||||||||||||||||||||||||||||||||||||||||||||||||||||||||||||||||||||||||||||||||
2002 - 2018 National Fire Incident Reporting System (NFIRS) incidents
- Incident types reported to NFIRS in Wolfe City, TX
- 68147.1%Rescue & EMS
- 39727.4%Fire
- 14910.3%Good Intent Call
- 1107.6%Hazardous Condition
- 865.9%Service Call
- 181.2%False Alarm
- 60.4%Severe Weather
- Fire incident types reported to NFIRS in Wolfe City, TX
- 23559.2%Outside Fires
- 12431.2%Structure Fires
- 307.6%Mobile Property/Vehicle Fires
- 82.0%Other
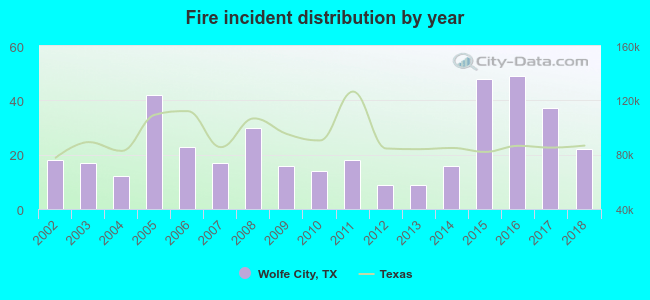 According to the data from the years 2002 - 2018 the average number of fires per year is 23. The highest number of reported fires - 49 took place in 2016, and the least - 9 in 2012. The data has a rising trend.
 17.6% incidents where reported in the morning and 82.4% in the evening. The most fires (15.6%) took place on Tuesday, and the least (13.1%) on Sunday.
 According to the 397 incident reports from years 2002 - 2018 most fires (11.6%) took place during January, and the least (4.0%) in April.
 Out of all 1,447 cases reported during the years 2002 - 2018, the most belonged to the categories: Overpressure Rupture (47.1%), Fire (27.4%), and Service Call (10.3%).
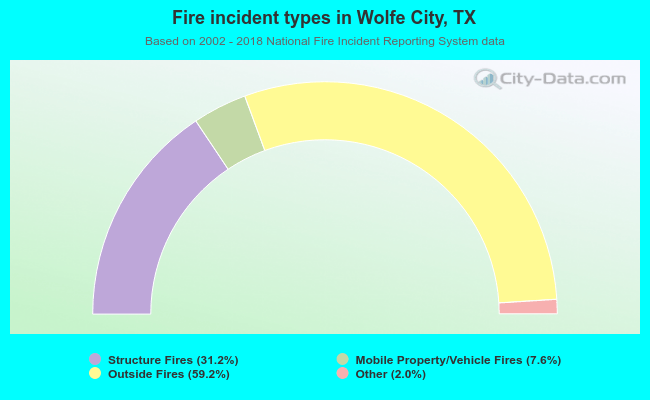 When looking into fire subcategories, the most reports belonged to: Outside Fires (59.2%), and Structure Fires (31.2%).