Wittenberg: Fire Incidents, Wisconsin (WI)
Where are fire incidents reported in Wittenberg, WI
Something went wrong! Please refresh the page.
|
| |||||||||||||||||||||||||||||||||||||||||||||||||||||||||||||||||||||||||||||||||||||||||||||||||||||||||||||
2004 - 2018 National Fire Incident Reporting System (NFIRS) incidents
- Incident types reported to NFIRS in Wittenberg, WI
- 11553.2%Fire
- 3415.7%Rescue & EMS
- 3315.3%Hazardous Condition
- 219.7%Good Intent Call
- 73.2%False Alarm
- 41.9%Service Call
- 20.9%Overpressure Rupture
- Fire incident types reported to NFIRS in Wittenberg, WI
- 4539.1%Outside Fires
- 4337.4%Structure Fires
- 1815.7%Mobile Property/Vehicle Fires
- 97.8%Other
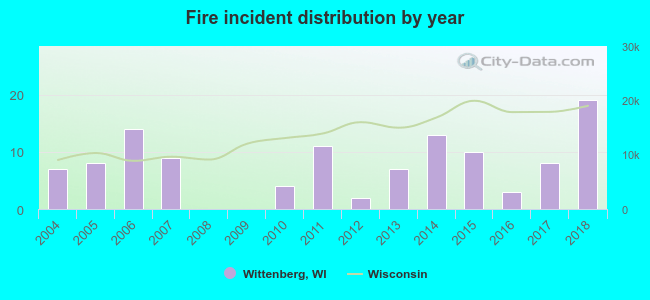 Based on the data from the years 2004 - 2018 the average number of fires per year is 8. The highest number of fire incidents - 19 took place in 2018, and the least - 0 in 2008. The data has a rising trend.
 33.9% incidents where reported in the morning and 66.1% in the evening. The most fires (19.1%) took place on Sunday, and the least (8.7%) on Friday.
 According to the 115 fire incidents from years 2004 - 2018 most fires (21.7%) took place during April, and the least (1.7%) in February.
 Out of all 216 cases reported during the years 2004 - 2018, the most belonged to the categories: Fire (53.2%), Rescue & EMS (15.7%), and Hazardous Condition (15.3%).
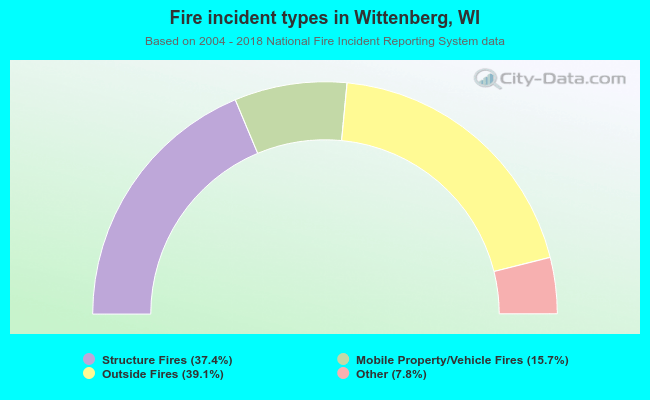 When looking into fire subcategories, the most reports belonged to: Outside Fires (39.1%), and Structure Fires (37.4%).