Witt: Fire Incidents, Illinois (IL)
Where are fire incidents reported in Witt, IL
Something went wrong! Please refresh the page.
|
| |||||||||||||||||||||||||||||||||||||||||||||||||||||||||||||||||||||||||||||||||||||||||||||||||||||||||||||
2004 - 2018 National Fire Incident Reporting System (NFIRS) incidents
- Incident types reported to NFIRS in Witt, IL
- 34758.3%Rescue & EMS
- 13322.4%Fire
- 7312.3%Hazardous Condition
- 172.9%Good Intent Call
- 111.8%False Alarm
- 91.5%Service Call
- 40.7%Special Incident
- 10.2%Overpressure Rupture
- Fire incident types reported to NFIRS in Witt, IL
- 7455.6%Structure Fires
- 4130.8%Outside Fires
- 107.5%Mobile Property/Vehicle Fires
- 86.0%Other
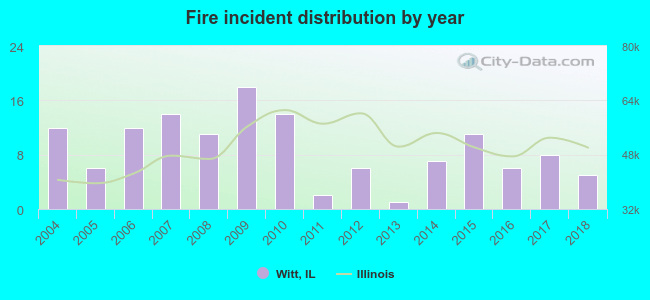 According to the data from the years 2004 - 2018 the average number of fires per year is 9. The highest number of fires - 18 took place in 2009, and the least - 1 in 2013. The data has a decreasing trend.
 30.8% incidents where reported in the morning and 69.2% in the evening. The most fires (19.5%) took place on Tuesday, and the least (5.3%) on Sunday.
 According to the 133 incident reports from years 2004 - 2018 most fires (15.8%) took place during March, and the least (5.3%) in July.
 Out of all 595 cases reported during the years 2004 - 2018, the most belonged to the categories: Rescue & EMS (58.3%), Fire (22.4%), and Hazardous Condition (12.3%).
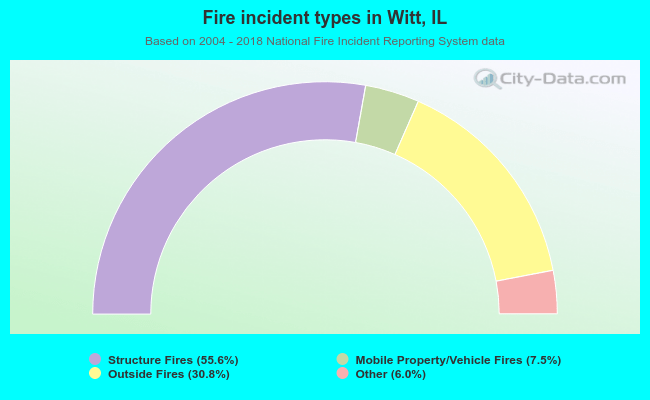 When looking into fire subcategories, the most incidents belonged to: Structure Fires (55.6%), and Outside Fires (30.8%).