| Fire incidents reported |
|---|
| Sreet name | Count |
|---|
| 852 RD | 6 | | 56634 855 RD | 4 | | 847 RD | 4 | | 84833 570 AVE | 4 | | 85176 564 AVE | 4 | | BRESSLER | 4 | | HUNTER ST | 4 | | VROMAN | 4 | | 1 12 N OF TOWN ON HWY 35 | 2 | | 1 ML S5 E OF TOWN | 2 | | 2 MLS N 18 ML W OF TOWN | 2 | | 2 MLS N 275 W OF WINSIDE | 2 | | 213 VROMAN ST. | 2 | | 309 HUNTER ST | 2 | | 35 HWY | 2 | | 4 MILES WEST AND | 2 | | 4 N 2 E5 S OF TOWN | 2 | | 400 VROMAN | 2 | | 5 W5 S OF TOWN | 2 | | 511 HUNTER ST. | 2 | | 565 AVE | 2 | | 565TH AVE | 2 | | 566 AVE & HWY 35 | 2 | | 56715 849 RD | 2 | | 56753 &852 RD | 2 |
| | | Fire incidents reported |
|---|
| Sreet name | Count |
|---|
| 56755 852 RD | 2 | | 56800 851 RD | 2 | | 568TH AVE | 2 | | 56900 847 RD. | 2 | | 56927 847 RD | 2 | | 56950 847 RD | 2 | | 569TH AVE | 2 | | 57000 850 RD | 2 | | 57081 847 RD | 2 | | 57196 853 RD | 2 | | 84833 570TH AVE | 2 | | 849 RD | 2 | | 85000 570TH AVE | 2 | | 85142 565 AVE | 2 | | 85144 566 AVE | 2 | | 85273 566 AVE | 2 | | 853 RD | 2 | | 85352 569 AVE | 2 | | 855 RD | 2 | | 85500 HWY 35 | 2 | | 85550 560TH AVE | 2 | | 85579 565 AVE | 2 | | CHAPEN ST | 2 | | HWY. 35 | 2 | | |
|
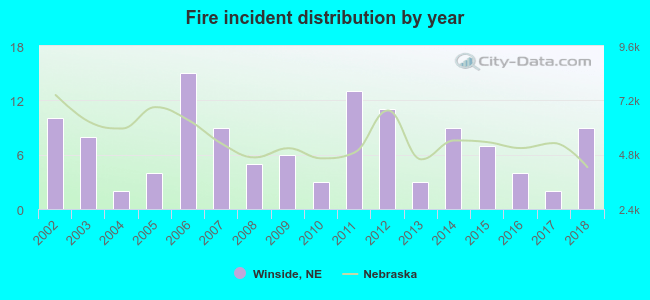 According to the data from the years 2002 - 2018 the average number of fires per year is 7. The highest number of reported fire incidents - 15 took place in 2006, and the least - 2 in 2004. The data has a decreasing trend.
 13.3% incidents where reported in the morning and 86.7% in the evening. The most fires (20.0%) took place on Friday, and the least (10.0%) on Wednesday.
 According to the 120 fire incidents from years 2002 - 2018 most fires (15.8%) took place during November, and the least (3.3%) in June.
 Out of all 455 cases reported during the years 2002 - 2018, the most belonged to the categories: Service Call (56.9%), Fire (26.4%), and Overpressure Rupture (11.0%).
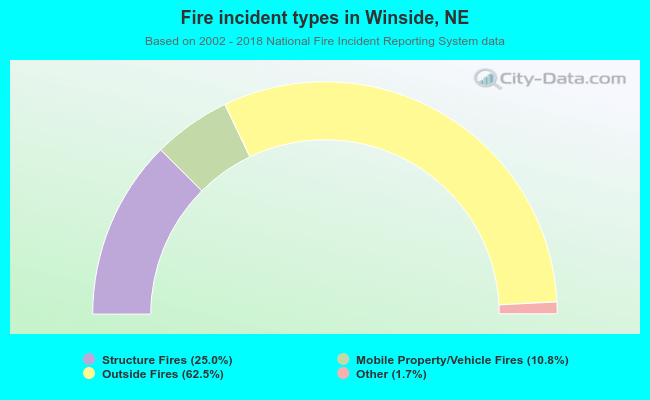 When looking into fire subcategories, the most reports belonged to: Outside Fires (62.5%), and Structure Fires (25.0%).