Winnemucca: Fire Incidents, Nevada (NV)
Where are fire incidents reported in Winnemucca, NV
Something went wrong! Please refresh the page.
|
| |||||||||||||||||||||||||||||||||||||||||||||||||||||||||||||||||||||||||||||||||||||||||||||||||||||||||||||
| Other | 114 | |||||||||||||||||||||||||||||||||||||||||||||||||||||||||||||||||||||||||||||||||||||||||||||||||||||||||||||
2002 - 2018 National Fire Incident Reporting System (NFIRS) incidents
- Incident types reported to NFIRS in Winnemucca, NV
- 40246.2%Fire
- 20123.1%Rescue & EMS
- 9510.9%Hazardous Condition
- 758.6%Good Intent Call
- 708.0%False Alarm
- 192.2%Service Call
- 60.7%Severe Weather
- 20.2%Special Incident
- 10.1%Overpressure Rupture
- Fire incident types reported to NFIRS in Winnemucca, NV
- 27468.2%Outside Fires
- 7719.2%Structure Fires
- 358.7%Mobile Property/Vehicle Fires
- 164.0%Other
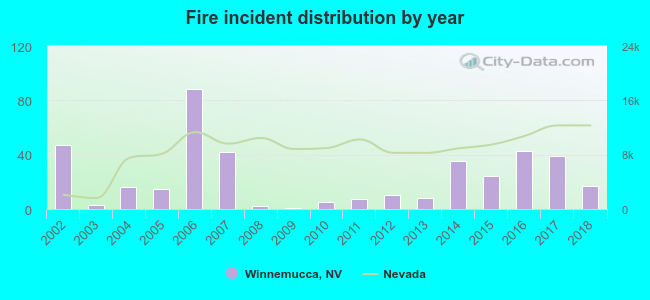 According to the data from the years 2002 - 2018 the average number of fires per year is 24. The highest number of reported fire incidents - 88 took place in 2006, and the least - 1 in 2009. The data has a dropping trend.
The average number of yearly fire incidents per 10k residents in Winnemucca, NV compared to nearest cities:
(Note: Based on data for the last 3 years, including only cities with population 5,000 and above)
| Winnemucca: | 41.2 |
| Golconda: | 3.6 |
| Elko: | 47.8 |
| Spring Creek: | 35.1 |
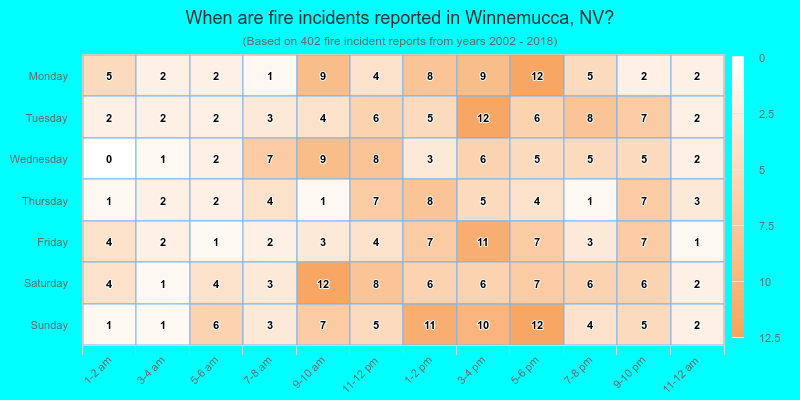
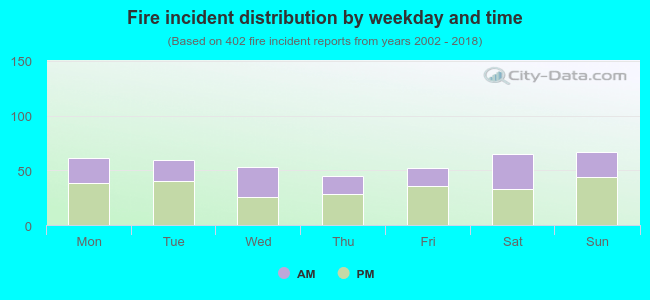 39.1% incidents where reported in the morning and 60.9% in the evening. The most fires (16.7%) took place on Sunday, and the least (11.2%) on Thursday.
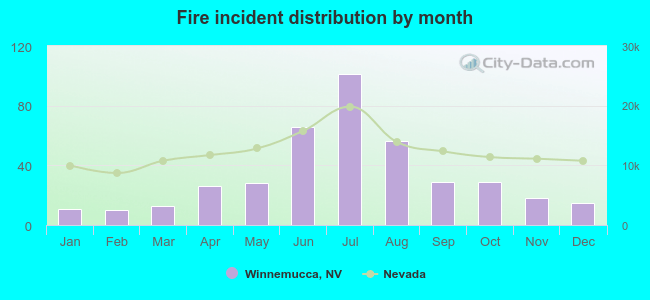 Based on the 402 fire incident reports from years 2002 - 2018 most fires (25.1%) took place during July, and the least (2.5%) in February.
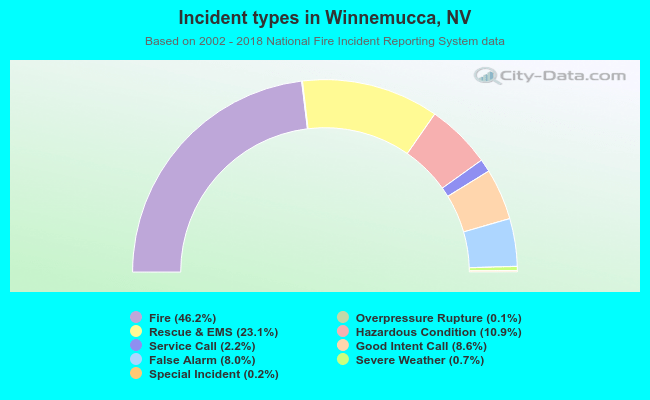 Out of all 871 cases reported during the years 2002 - 2018, the most belonged to the categories: Fire (46.2%), Rescue & EMS (23.1%), and Hazardous Condition (10.9%).
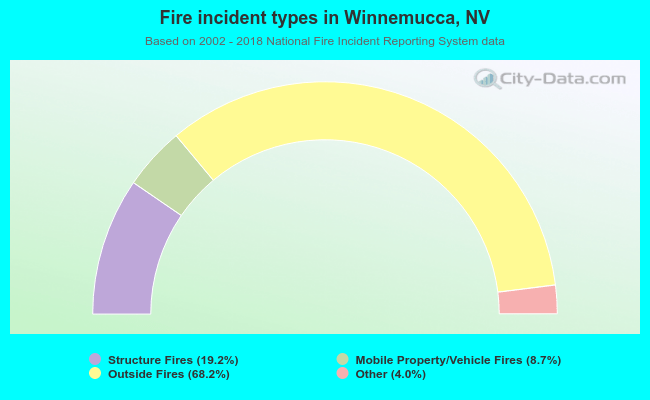 When looking into fire subcategories, the most incidents belonged to: Outside Fires (68.2%), and Structure Fires (19.2%).