| Fire incidents reported |
|---|
| Sreet name | Count |
|---|
| COUNTY D RD | 12 | | STATE 116 HWY | 12 | | COUNTY B RD | 8 | | COUNTY F RD | 8 | | COUNTY G RD | 8 | | JACQUIS RD | 8 | | 37TH AVE | 6 | | CROSS RD | 6 | | WASHINGTON STREET ST | 6 | | 5379 CTY RD G | 4 | | CLARKS POINT RD | 4 | | CLEVELAND ST | 4 | | COUNTY GG RD | 4 | | COURTNEY PLUMMER RD | 4 | | CRYSTAL CT | 4 | | FIFTH ST | 4 | | FIRST ST | 4 | | LEE RD | 4 | | MAIN ST | 4 | | OAK HILL RD | 4 | | RUSHFORD AVE | 4 | | SEVENTH AVE | 4 | | STARVIEW DR | 4 | | TREELAND CT | 4 | | TRITT RD | 4 |
| | | Fire incidents reported |
|---|
| Sreet name | Count |
|---|
| WINDUSTRIAL RD | 4 | | 100 N 4TH STREET | 2 | | 150 TWIN HARBOR DR | 2 | | 165 TWIN HARBOR DRIVE | 2 | | 1ST | 2 | | 209 N 7TH AVE | 2 | | 214 N 7TH AVE | 2 | | 3RD AV AVE | 2 | | 3RD ST | 2 | | 4 S 3RD STREET | 2 | | 409 N 7TH ST | 2 | | 4965 SPIEGELBERG RD. | 2 | | 5091 GRIMSON ROAD | 2 | | 5153 LASLEY PT LGTS | 2 | | 5747 HWY116 | 2 | | 5920 HIAWATHA HEIGHTS | 2 | | 5924 COURTNEY PLUMMER RD | 2 | | 6103 E LYNGAAS RD | 2 | | 6173 W. LYNGAAS ROAD | 2 | | 6219 LEE ROAD | 2 | | 6551 WOODVIEW RD | 2 | | 6633 LASLEY SHORE DRIVE | 2 | | 705 MAIN ST E | 2 | | 7203 CLARKS POINT RD. | 2 | | |
|
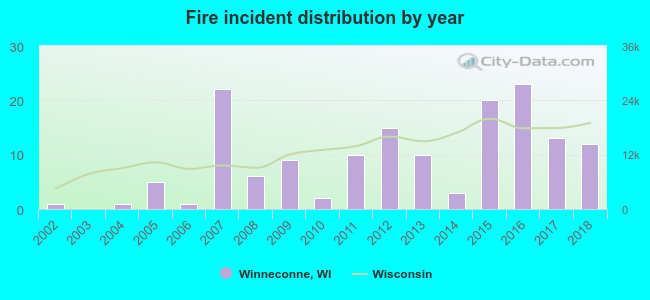 Based on the data from the years 2002 - 2018 the average number of fires per year is 9. The highest number of fire incidents - 23 took place in 2016, and the least - 0 in 2003. The data has a rising trend.
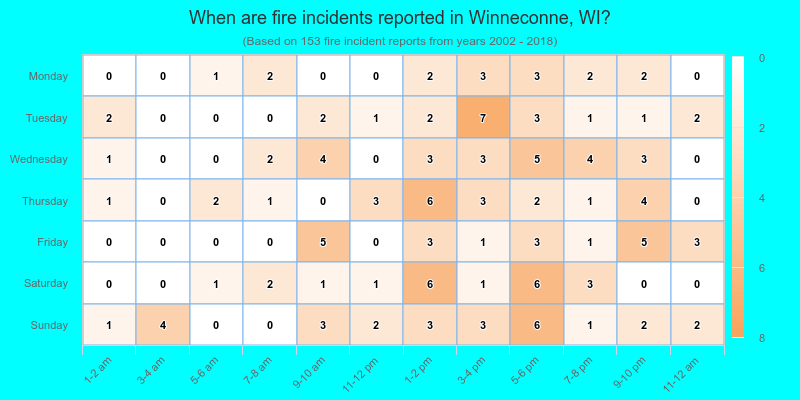
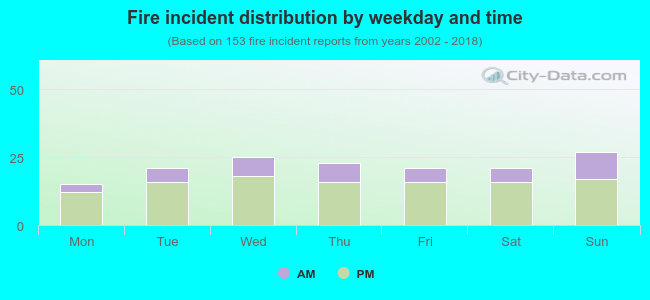 27.5% incidents where reported in the morning and 72.5% in the evening. The most fires (17.6%) took place on Sunday, and the least (9.8%) on Monday.
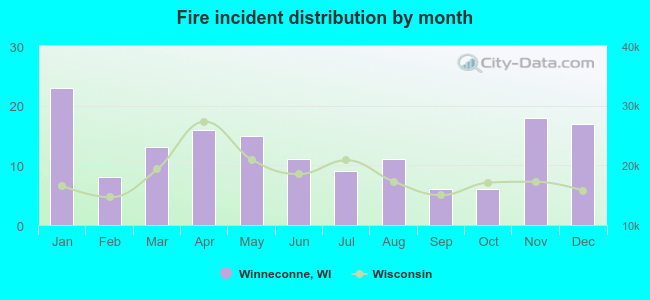 According to the 153 fire incidents from years 2002 - 2018 most fires (15.0%) took place during January, and the least (3.9%) in September.
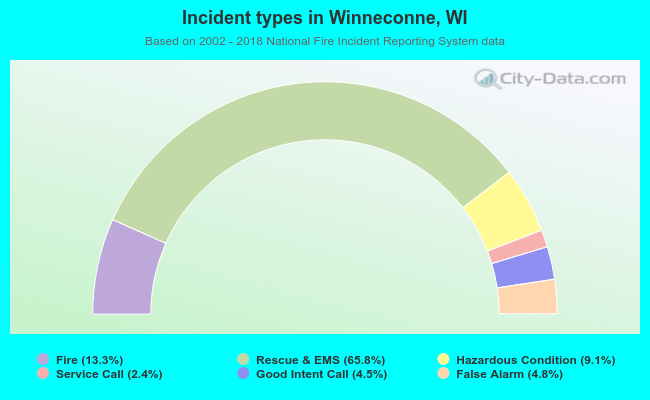 Out of all 1,149 cases reported during the years 2002 - 2018, the most belonged to the categories: Overpressure Rupture (65.8%), Fire (13.3%), and Rescue & EMS (9.1%).
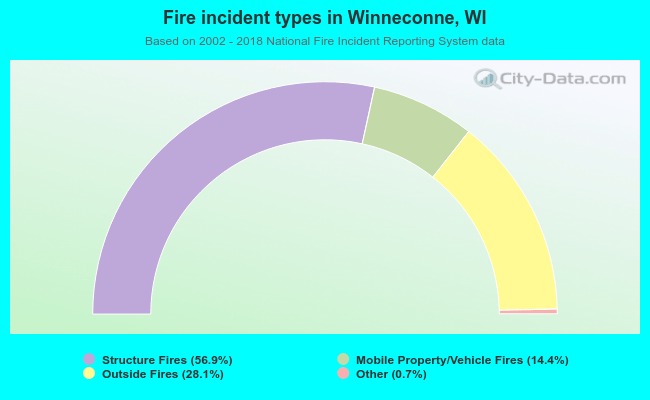 When looking into fire subcategories, the most reports belonged to: Structure Fires (56.9%), and Outside Fires (28.1%).