Winnebago: Fire Incidents, Nebraska (NE)
Where are fire incidents reported in Winnebago, NE
Something went wrong! Please refresh the page.
|
| |||||||||||||||||||||||||||||||||||||||||||||||||||||||||||||||||||||||||||||||||||||||||||||||||||||||||||||
| Other | 15 | |||||||||||||||||||||||||||||||||||||||||||||||||||||||||||||||||||||||||||||||||||||||||||||||||||||||||||||
2005 - 2018 National Fire Incident Reporting System (NFIRS) incidents
- Incident types reported to NFIRS in Winnebago, NE
- 24558.9%Fire
- 6114.7%Hazardous Condition
- 327.7%Rescue & EMS
- 317.5%Good Intent Call
- 245.8%False Alarm
- 184.3%Service Call
- 30.7%Special Incident
- 20.5%Severe Weather
- Fire incident types reported to NFIRS in Winnebago, NE
- 15061.2%Outside Fires
- 6426.1%Structure Fires
- 2610.6%Mobile Property/Vehicle Fires
- 52.0%Other
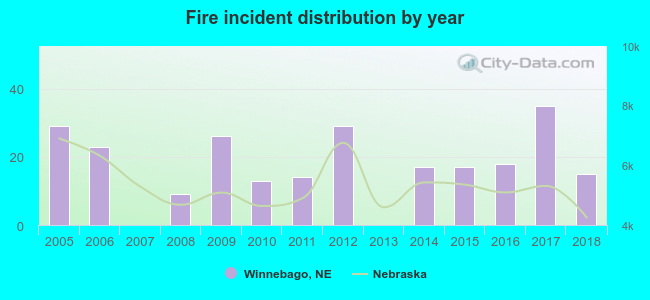 According to the data from the years 2005 - 2018 the average number of fires per year is 18. The highest number of reported fire incidents - 35 took place in 2017, and the least - 0 in 2007. The data has a decreasing trend.
 22.0% incidents where reported in the morning and 78.0% in the evening. The most fires (16.7%) took place on Monday, and the least (12.7%) on Wednesday.
 According to the 245 fire incidents from years 2005 - 2018 most fires (20.8%) took place during April, and the least (2.4%) in January.
 Out of all 416 cases reported during the years 2005 - 2018, the most belonged to the categories: Fire (58.9%), Rescue & EMS (14.7%), and Overpressure Rupture (7.7%).
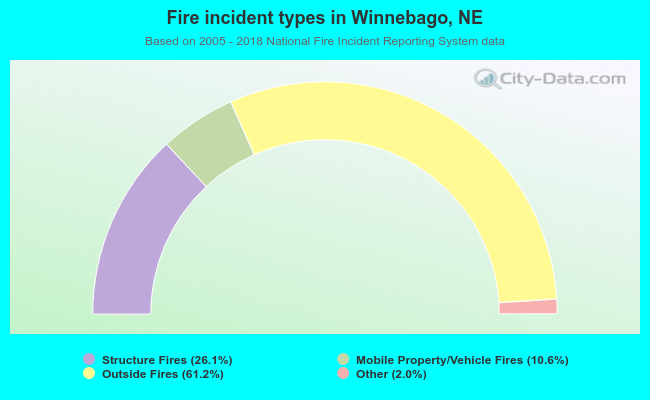 When looking into fire subcategories, the most reports belonged to: Outside Fires (61.2%), and Structure Fires (26.1%).