Windber: Fire Incidents, Pennsylvania (PA)
Where are fire incidents reported in Windber, PA
Something went wrong! Please refresh the page.
|
| |||||||||||||||||||||||||||||||||||||||||||||||||||||||||||||||||||||||||||||||||||||||||||||||||||||||||||||
2003 - 2018 National Fire Incident Reporting System (NFIRS) incidents
- Incident types reported to NFIRS in Windber, PA
- 31727.6%Fire
- 31327.2%Hazardous Condition
- 18015.7%Rescue & EMS
- 17915.6%Service Call
- 564.9%Good Intent Call
- 564.9%False Alarm
- 403.5%Severe Weather
- 50.4%Special Incident
- 40.3%Overpressure Rupture
- Fire incident types reported to NFIRS in Windber, PA
- 21768.5%Structure Fires
- 6319.9%Outside Fires
- 196.0%Other
- 185.7%Mobile Property/Vehicle Fires
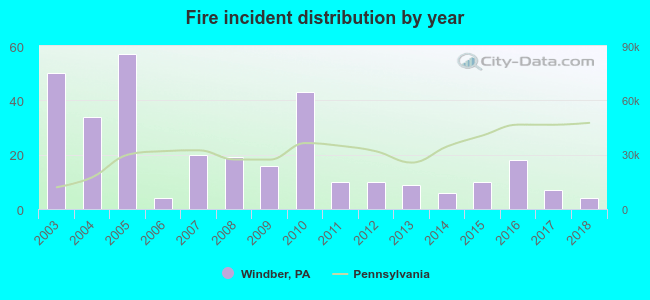 According to the data from the years 2003 - 2018 the average number of fire incidents per year is 20. The highest number of reported fires - 57 took place in 2005, and the least - 4 in 2006. The data has a dropping trend.
 34.7% incidents where reported in the morning and 65.3% in the evening. The most fires (23.0%) took place on Tuesday, and the least (10.4%) on Sunday.
 Based on the 317 fire incidents from years 2003 - 2018 most fires (17.4%) took place during April, and the least (4.1%) in June.
 Out of all 1,150 cases reported during the years 2003 - 2018, the most belonged to the categories: Fire (27.6%), Hazardous Condition (27.2%), and Rescue & EMS (15.7%).
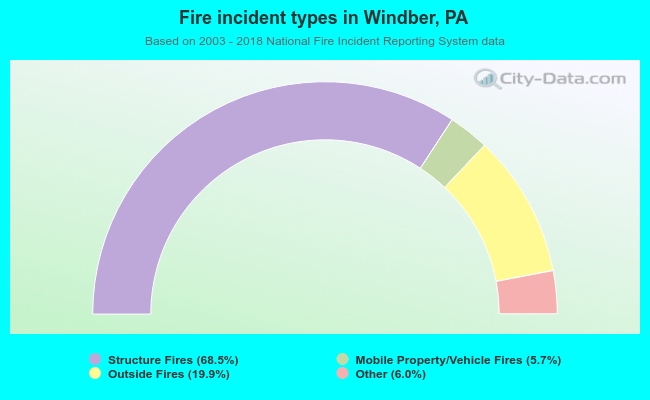 When looking into fire subcategories, the most reports belonged to: Structure Fires (68.5%), and Outside Fires (19.9%).