| Fire incidents reported |
|---|
| Sreet name | Count |
|---|
| COMMERCE ST | 116 | | MIDDLE AVE | 82 | | AIRBRAKE AVE | 60 | | STATE ST | 46 | | WELSH AVE | 40 | | MARGUERITE AVE | 28 | | WESTINGHOUSE AVE | 20 | | STATION ST | 16 | | 5TH ST | 14 | | PATTON ST | 14 | | BRIDGE ST | 12 | | CALDWELL AVE | 12 | | LOCUST ALY | 10 | | THIRD ST | 10 | | CSX TRAK | 8 | | PITCAIRN ST | 8 | | WATKINS AVE | 8 | | MORNINGSIDE AVE | 6 | | ST. JOESPH DR | 6 | | WALL ST | 6 | | AIR BRAKE AVE | 4 | | AIRBRAKE AVE WIM | 4 | | COMMERCE | 4 | | COMMERCE STS | 4 | | HERMAN AVE | 4 |
| | | Fire incidents reported |
|---|
| Sreet name | Count |
|---|
| MEMORIAL DR | 4 | | MIDDLE | 4 | | MIDDLE AVE WIM | 4 | | ST JOESPH DR | 4 | | WESTINGHOUSE | 4 | | WESTINGHOUSE AVE WIM | 4 | | 201 MARGUERITE AVENUE | 2 | | 210 MARGUERITE AVENUE | 2 | | 3RD ST | 2 | | 760 AIR BRAKE AVE. | 2 | | AVENUE U | 2 | | AVENVE U AVE | 2 | | BANQUETS UNLIMITED | 2 | | BLK MARGUERITE AVE | 2 | | BLUFF ST | 2 | | BRIDGE | 2 | | BRIDGE ST | 2 | | BRIDGE STREET | 2 | | FIFTH ST | 2 | | FRANK ST | 2 | | GREENSBURG PIKE | 2 | | ICE PLANT HILL | 2 | | KINGS WAY | 2 | | MAPLE ST | 2 | | MARGARIETE AVE | 2 |
|
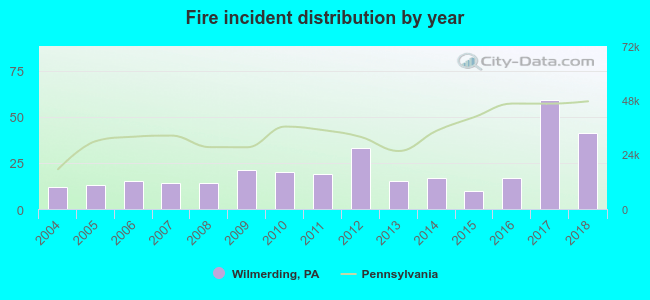 According to the data from the years 2004 - 2018 the average number of fire incidents per year is 21. The highest number of fires - 59 took place in 2017, and the least - 10 in 2015. The data has a growing trend.
 37.5% incidents where reported in the morning and 62.5% in the evening. The most fires (18.4%) took place on Saturday, and the least (9.7%) on Sunday.
 Based on the 320 fire incidents from years 2004 - 2018 most fires (13.4%) took place during July, and the least (5.3%) in October.
 Out of all 1,109 cases reported during the years 2004 - 2018, the most belonged to the categories: Hazardous Condition (32.3%), Fire (28.9%), and Good Intent Call (15.5%).
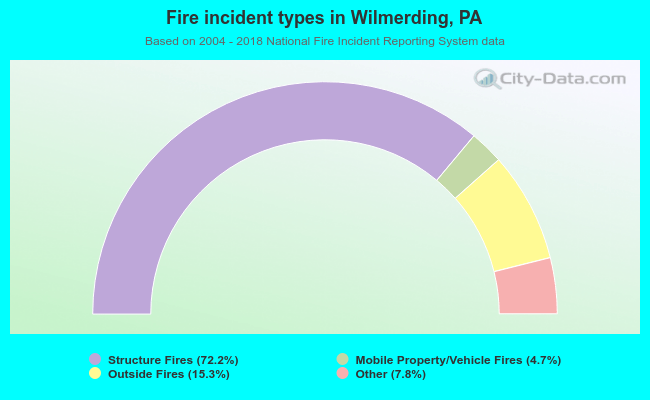 When looking into fire subcategories, the most reports belonged to: Structure Fires (72.2%), and Outside Fires (15.3%).