| Fire incidents reported |
|---|
| Sreet name | Count |
|---|
| 5TH ST | 4 | | 7TH ST | 4 | | HIGHLAND AVE | 4 | | KELLER LN | 4 | | ONWARD RD | 4 | | ROYALTY ST | 4 | | WILLIAMS AVE | 4 | | 100 BIG RUN ROAD | 2 | | 101 SNODGRASS LANE | 2 | | 1042 SUNSHINE MOUNTAIN ROAD | 2 | | 107 FRONT STREET | 2 | | 109 W 7TH | 2 | | 11 BOAZ GARDEN DRIVE | 2 | | 114 EAST 4TH STREET | 2 | | 115 W. 7TH ST | 2 | | 117 W 9TH ST | 2 | | 12839 EMERSON AVENUE | 2 | | 12TH ST | 2 | | 13135 EMERSON AVE. | 2 | | 133 ROCKLAND DRIVE | 2 | | 15514 EMERSON AVEBUE | 2 | | 159 KITTLE STREET | 2 | | 181 MILE MARKER I77 | 2 | | 1830 GREATHOUSE ROAD | 2 | | 184 MILE POST | 2 |
| | | Fire incidents reported |
|---|
| Sreet name | Count |
|---|
| 184 MILE POST I77 | 2 | | 185 MILE POST | 2 | | 201 WOODVIEW DRIVE | 2 | | 212 2ND STREET | 2 | | 212 SECOND STREET | 2 | | 2134 KELLAR LANE | 2 | | 215 HIHGLAND AVENUE | 2 | | 2802 13 AVENUE | 2 | | 285 COOPERS RIDGE | 2 | | 293 GREENBRIER AVENUE | 2 | | 2ND ST | 2 | | 2ND STRE | 2 | | 312 WAVERLY ROAD | 2 | | 3131 FRONT STREET | 2 | | 339 CASTO LANE | 2 | | 360 MOUNTAINEER DRIVE | 2 | | 4-1/2 ST. | 2 | | 404 2ND. ST | 2 | | 404 CHERRY AVENUE | 2 | | 404 WEST SECOND STREET | 2 | | 410 SHAWNEE TRAILER PARK | 2 | | 420 POPULAR AVENUE | 2 | | 435 COLUMBIA AVE | 2 | | 48 MAPLE DRIVE MULLENEX | 2 | | |
|
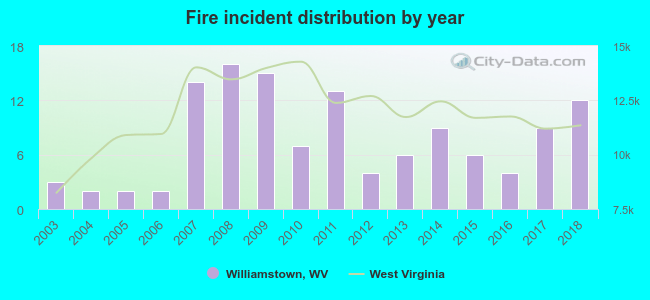 According to the data from the years 2003 - 2018 the average number of fires per year is 8. The highest number of fires - 16 took place in 2008, and the least - 2 in 2004. The data has an increasing trend.
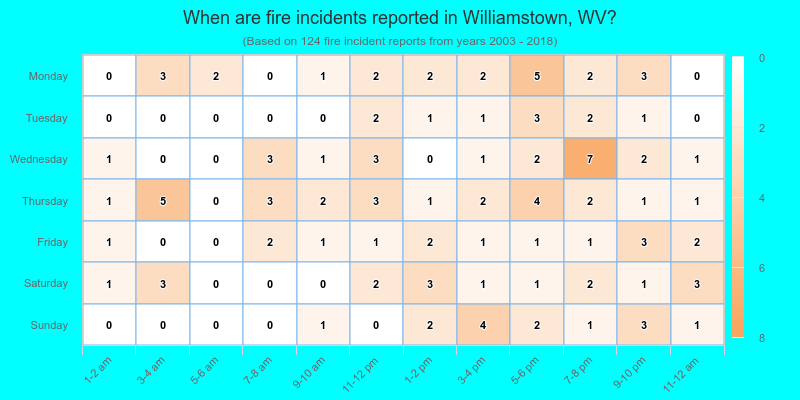
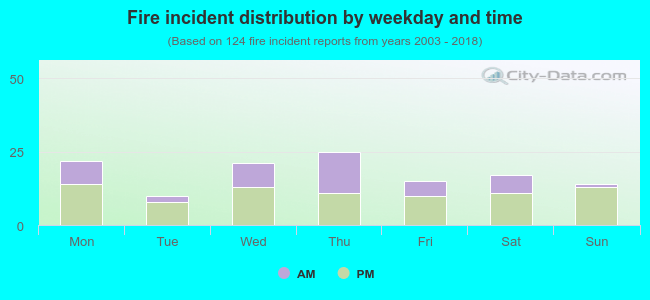 35.5% incidents where reported in the morning and 64.5% in the evening. The most fires (20.2%) took place on Thursday, and the least (8.1%) on Tuesday.
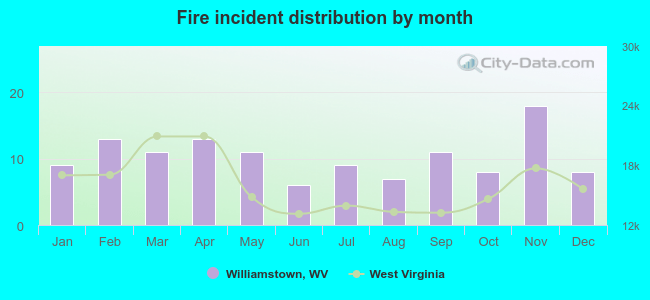 Based on the 124 fires from years 2003 - 2018 most fires (14.5%) took place during November, and the least (4.8%) in June.
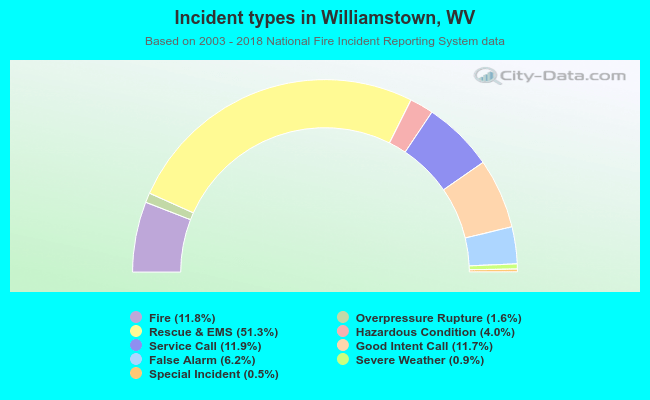 Out of all 1,047 cases reported during the years 2003 - 2018, the most belonged to the categories: Rescue & EMS (51.3%), Service Call (11.9%), and Fire (11.8%).
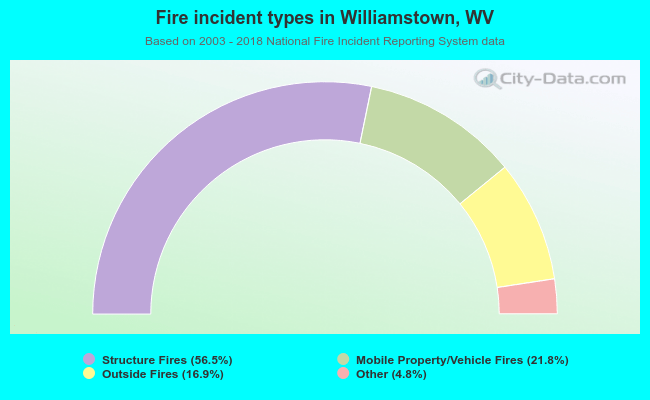 When looking into fire subcategories, the most reports belonged to: Structure Fires (56.5%), and Mobile Property/Vehicle Fires (21.8%).