| Fire incidents reported |
|---|
| Sreet name | Count |
|---|
| HWY 50 | 16 | | HWY 287 | 8 | | BENT CTY RD 36 | 6 | | CR LL | 6 | | HWY 196 | 6 | | HWY 196 HWY | 6 | | 3600 BLK HWY 50 | 4 | | BENT CTY RD 34 | 4 | | BETWEEN CTY RD 5 AND 6 | 4 | | CR 3 | 4 | | CR 5 AND 6 NORTH OF AMITY CANA | 4 | | HWY 287 HWY | 4 | | MILE MARKER 285 SOUTH OF THE | 4 | | STATE HWY 50 | 4 | | WILEY TREE DUMP | 4 | | 1 MILE SOUTH OF WILEY AND EAST | 2 | | 104 VICTORY LANE ST | 2 | | 1050 COUNTY RD RR RD | 2 | | 12 MILE EAST OF CTY RD 3 | 2 | | 12 MILE N OF HWY 50 MM426 | 2 | | 12 MILE S OF WILEY ON 287 | 2 | | 1200 BLK HWY 196 HWY | 2 | | 1278 COUNTY RD NN | 2 | | 1907 CTY RD RR | 2 | | 1960 CTY RD RR | 2 |
| | | Fire incidents reported |
|---|
| Sreet name | Count |
|---|
| 2 MILES EAST OF WILEY | 2 | | 200 BLOCK MAIN ST | 2 | | 209 GORDON | 2 | | 2258 HWY 50 | 2 | | 2260 CTY RD MM | 2 | | 2266 CTY RD MM | 2 | | 300 W 3RD | 2 | | 301 EAST 3RD | 2 | | 307 EAST 6TH STREET | 2 | | 3200 BLOCK HWY 50 | 2 | | 32000 BLOCK COUNTY RD. 1 RD | 2 | | 3267 HWY 50 HWY | 2 | | 3294 CR LL | 2 | | 3294 CTY RD LL | 2 | | 33300 CTY RD 3 | 2 | | 33499 HWY 287 | 2 | | 34 COR BENT COUNTY | 2 | | 34 MILES WEST OF HWY 287 | 2 | | 3400 CTY RD 6 | 2 | | 34000 BLK OF CTY RD NN | 2 | | 3500 BLK HIGHWAY 50 | 2 | | 3500 BLK OF HWY 196 | 2 | | 3500 BLOCK COUNTY RD. LL RD | 2 | | 3500 BLOCK OF SS | 2 | | |
|
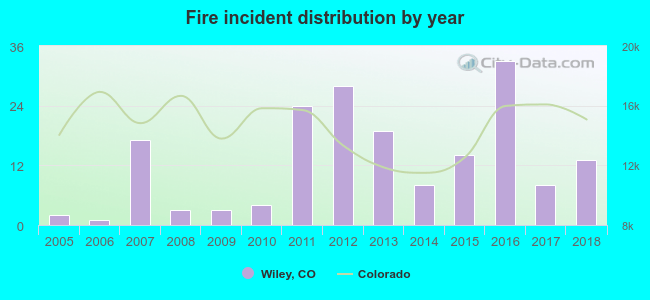 According to the data from the years 2005 - 2018 the average number of fires per year is 13. The highest number of reported fires - 33 took place in 2016, and the least - 1 in 2006. The data has a rising trend.
 29.9% incidents where reported in the morning and 70.1% in the evening. The most fires (19.8%) took place on Thursday, and the least (9.6%) on Monday.
 According to the 177 fires from years 2005 - 2018 most fires (26.6%) took place during March, and the least (0.6%) in December.
 Out of all 388 cases reported during the years 2005 - 2018, the most belonged to the categories: Fire (45.6%), Overpressure Rupture (30.9%), and Service Call (10.8%).
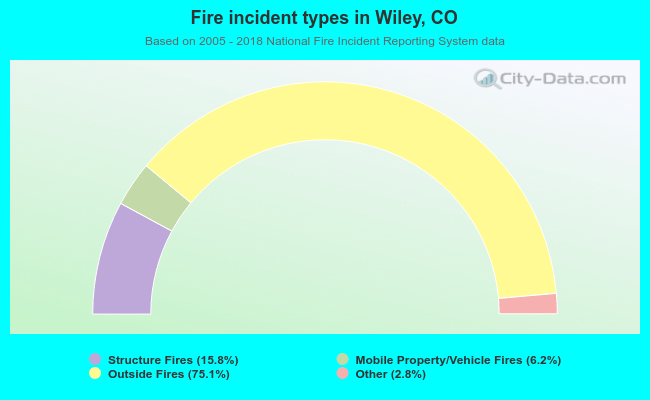 When looking into fire subcategories, the most incidents belonged to: Outside Fires (75.1%), and Structure Fires (15.8%).