| Fire incidents reported |
|---|
| Sreet name | Count |
|---|
| INTERSTATE 40 | 188 | | HIGHWAY 22 | 72 | | YUMA RD | 18 | | ROCK SPRINGS RD | 14 | | WILDERSVILLE RD | 12 | | EXCHANGE RD | 8 | | FARMSVILLE RD | 6 | | LONGSOUGHT RD | 6 | | NAPIER LN | 6 | | NEALIS WOODS RD | 6 | | SHORT DR | 6 | | CODY HILL RD | 4 | | FARMSVILLE RD | 4 | | KEE RD | 4 | | RUSH RD | 4 | | SAFFORD MILL LN | 4 | | STRAYLEAF RD | 4 | | STRAYLEAF RD | 4 | | BEAVER SCHOOL LN | 2 | | BLUEGRASS LN | 2 | | CEDAR HILL CHURCH RD | 2 | | CHAROLAIS LN | 2 | | CORNITH RD | 2 | | COUNTY LINE RD | 2 | | COUNTY LINE RD | 2 |
| | | Fire incidents reported |
|---|
| Sreet name | Count |
|---|
| CROCKETT RD | 2 | | DARDEN-CHRISTAIN CHAPEL RD | 2 | | EXPRESSWAY CHURCH RD | 2 | | FEDERAL LN | 2 | | HEMBY LN | 2 | | HIGHWAY 22 | 2 | | INTERSTATE 40 OVERPASS | 2 | | INTERSTATE 40 RD | 2 | | LONGSOUGHT RD | 2 | | LONGSOUTHT RD | 2 | | MCKAY LN | 2 | | NATCHEZ TRACE RD | 2 | | NEALIS WOODS RD | 2 | | OLD EXCHANGE RD | 2 | | OLD GORDON RD | 2 | | PARKER CIR | 2 | | PARKER CIRCLE | 2 | | PARSONS RD | 2 | | PENIX LN | 2 | | PIN OAK LODGE LN | 2 | | RAMBLEWOOD LN | 2 | | ROCK SPRINGS RD | 2 | | ROCK SPRINGS CEM RD | 2 | | SAFFORD MILL LN | 2 | | SANSONE LN | 2 |
|
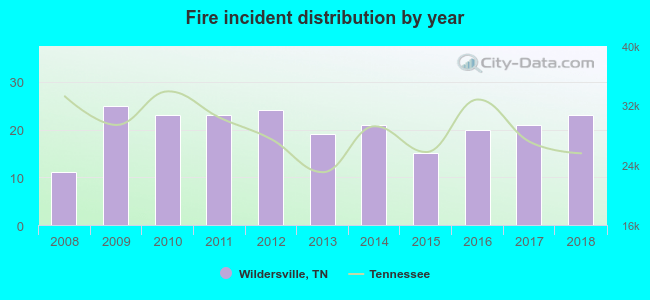 Based on the data from the years 2008 - 2018 the average number of fire incidents per year is 20. The highest number of reported fires - 25 took place in 2009, and the least - 11 in 2008. The data has a rising trend.
 34.7% incidents where reported in the morning and 65.3% in the evening. The most fires (17.3%) took place on Sunday, and the least (10.7%) on Monday.
 Based on the 225 fires from years 2008 - 2018 most fires (11.6%) took place during February, and the least (4.4%) in May.
 Out of all 388 cases reported during the years 2008 - 2018, the most belonged to the categories: Fire (58.0%), Service Call (17.0%), and Rescue & EMS (11.9%).
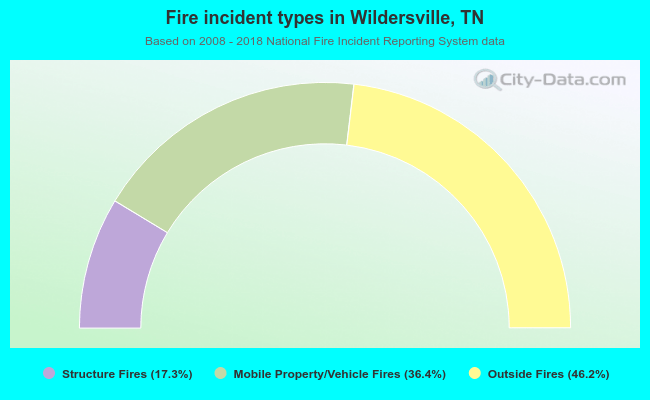 When looking into fire subcategories, the most reports belonged to: Outside Fires (46.2%), and Mobile Property/Vehicle Fires (36.4%).