Wiggins: Fire Incidents, Colorado (CO)
Where are fire incidents reported in Wiggins, CO
Something went wrong! Please refresh the page.
|
| |||||||||||||||||||||||||||||||||||||||||||||||||||||||||||||||||||||||||||||||||||||||||||||||||||||||||||||
2004 - 2018 National Fire Incident Reporting System (NFIRS) incidents
- Incident types reported to NFIRS in Wiggins, CO
- 23750.4%Fire
- 15533.0%Rescue & EMS
- 326.8%Hazardous Condition
- 326.8%Good Intent Call
- 51.1%Service Call
- 51.1%False Alarm
- 20.4%Severe Weather
- 20.4%Special Incident
- Fire incident types reported to NFIRS in Wiggins, CO
- 15866.7%Outside Fires
- 3514.8%Structure Fires
- 3213.5%Mobile Property/Vehicle Fires
- 125.1%Other
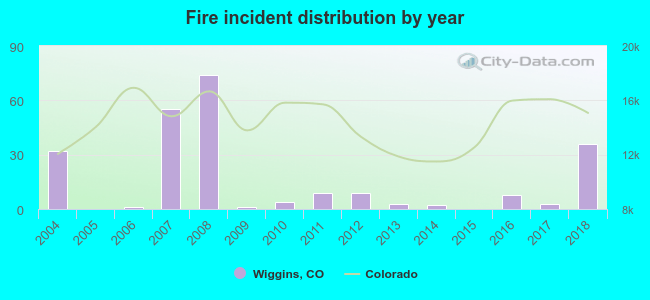 Based on the data from the years 2004 - 2018 the average number of fire incidents per year is 16. The highest number of reported fires - 74 took place in 2008, and the least - 0 in 2005. The data has a growing trend.
 19.8% incidents where reported in the morning and 80.2% in the evening. The most fires (18.6%) took place on Saturday, and the least (11.0%) on Tuesday.
 Based on the 237 fire incidents from years 2004 - 2018 most fires (15.2%) took place during July, and the least (3.0%) in January.
 Out of all 470 cases reported during the years 2004 - 2018, the most belonged to the categories: Fire (50.4%), Overpressure Rupture (33.0%), and Rescue & EMS (6.8%).
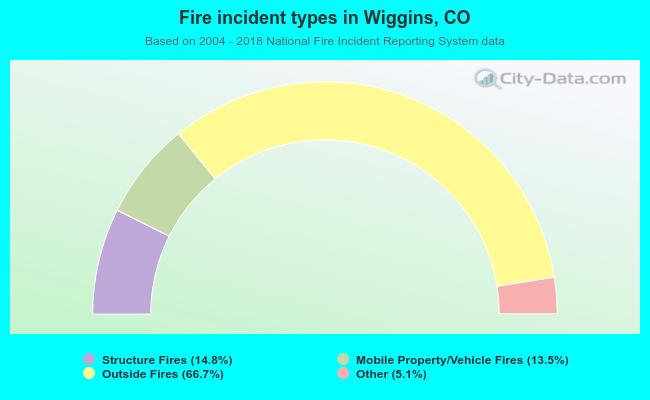 When looking into fire subcategories, the most incidents belonged to: Outside Fires (66.7%), and Structure Fires (14.8%).