Whitman: Fire Incidents, Massachusetts (MA)
Where are fire incidents reported in Whitman, MA
Something went wrong! Please refresh the page.
| Fire incidents reported | |
|---|---|
| Sreet name | Count |
| BEDFORD ST. | 120 |
| SOUTH AVE. | 96 |
| WASHINGTON ST. | 68 |
| TEMPLE ST. | 46 |
| AUBURN ST. | 34 |
| ESSEX ST. | 32 |
| BEDFORD ST | 30 |
| FRANKLIN ST. | 30 |
| OUT OF TOWN | 26 |
| BEDFORD ST | 22 |
| LINDEN ST. | 22 |
| PLYMOUTH ST. | 22 |
| SCHOOL ST. | 22 |
| PINE ST. | 20 |
| WASHINGTON ST | 20 |
| FRANKLIN ST | 16 |
| HARVARD ST. | 16 |
| SOUTH AVE | 16 |
| COLEBROOK BLVD. | 14 |
| HIGH ST. | 14 |
| MARBLE ST | 14 |
| PARK AVE. | 14 |
| WEST ST. | 14 |
| EDWARD DR | 12 |
| RAYNOR AVE. | 12 |
| SOUTH AVE | 12 |
| WASHINGTON ST | 12 |
| AUBURN ST | 10 |
| BEULAH ST. | 10 |
| CARLETON ST. | 10 |
2002 - 2018 National Fire Incident Reporting System (NFIRS) incidents
- Incident types reported to NFIRS in Whitman, MA
- 7,09253.0%Rescue & EMS
- 2,20316.5%Hazardous Condition
- 1,65912.4%Service Call
- 9427.0%False Alarm
- 7505.6%Fire
- 6765.1%Good Intent Call
- 290.2%Special Incident
- 160.1%Overpressure Rupture
- Fire incident types reported to NFIRS in Whitman, MA
- 35847.7%Structure Fires
- 31241.6%Outside Fires
- 739.7%Mobile Property/Vehicle Fires
- 70.9%Other
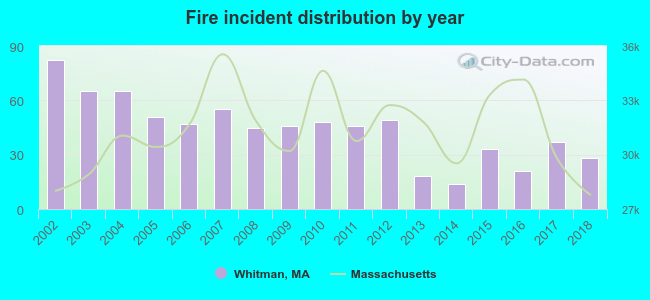 Based on the data from the years 2002 - 2018 the average number of fire incidents per year is 44. The highest number of reported fires - 82 took place in 2002, and the least - 14 in 2014. The data has a decreasing trend.
The average number of yearly fire incidents per 10k residents in Whitman, MA compared to nearest cities:
(Note: Based on data for the last 3 years, including only cities with population 5,000 and above)
| Whitman: | 19.8 |
| Abington: | 34.0 |
| Rockland: | 46.9 |
| East Bridgewater: | 25.9 |
| Brockton: | 60.2 |
| Hanover: | 38.7 |
| Holbrook: | 47.3 |
| West Bridgewater: | 57.4 |
| Bridgewater: | 125.4 |
 The median response time based on all reported fire incidents is 2 minutes. This is much lower than the state median value.
The median response time in Whitman, MA compared to nearest cities:
(Note: Based on data for all years, including only cities with at least 500 fire incidents)
| Whitman: | 2 minutes |
| Abington: | 4 minutes |
| Rockland: | 3 minutes |
| East Bridgewater: | 5 minutes |
| Brockton: | 4 minutes |
| Hanson: | 5 minutes |
| Hanover: | 5 minutes |
| Holbrook: | 3 minutes |
| West Bridgewater: | 4 minutes |
 Based on the reports from the years 2002 - 2018 the average number of fire-related casualties per year is 1. The highest number of reported casualties - 4 took place in 2004, and the lowest - 0 in 2005. The data has a decreasing trend.
The average number of casualties per 1,000 fires is 20. This indicator was the highest - 62 in 2004, and the lowest 0 in 2005. The trend for injuries per 1,000 fire incidents is decreasing. Compared to the Massachusetts value the number of injuries per 1,000 fires is much higher.
Based on the reports from the years 2002 - 2018 the average number of fire-related casualties per year is 1. The highest number of reported casualties - 4 took place in 2004, and the lowest - 0 in 2005. The data has a decreasing trend.
The average number of casualties per 1,000 fires is 20. This indicator was the highest - 62 in 2004, and the lowest 0 in 2005. The trend for injuries per 1,000 fire incidents is decreasing. Compared to the Massachusetts value the number of injuries per 1,000 fires is much higher.Casualties per 1,000 incidents in Whitman, MA compared to nearest cities:
(Note: Based on data for all years, including only cities with at least 500 fire incidents)
| Whitman: | 24.0 |
| Abington: | 15.5 |
| Rockland: | 37.3 |
| East Bridgewater: | 17.7 |
| Brockton: | 35.0 |
| Hanson: | 4.0 |
| Hanover: | 12.0 |
| Holbrook: | 12.3 |
| West Bridgewater: | 10.4 |
 30.0% incidents where reported in the morning and 70.0% in the evening. The most fires (15.3%) took place on Friday, and the least (12.5%) on Sunday.
 According to the 750 fire incident reports from years 2002 - 2018 most fires (12.7%) took place during April, and the least (5.6%) in October.
 Out of all 13,372 cases reported during the years 2002 - 2018, the most belonged to the categories: Rescue & EMS (53.0%), Hazardous Condition (16.5%), and Service Call (12.4%).
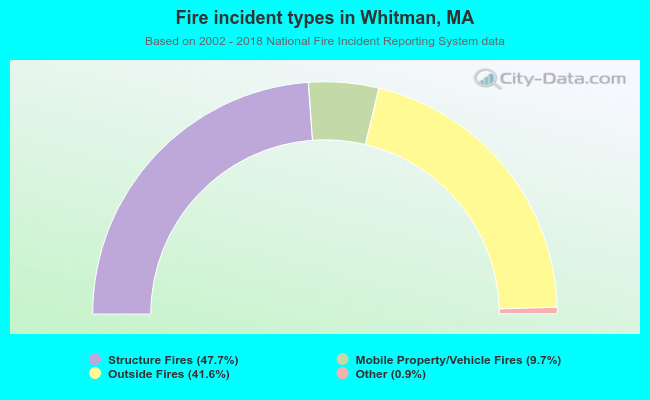 When looking into fire subcategories, the most reports belonged to: Structure Fires (47.7%), and Outside Fires (41.6%).