| Fire incidents reported |
|---|
| Sreet name | Count |
|---|
| K-45 HWY | 40 | | K45 HWY | 26 | | K-42 HWY | 24 | | I-29 HWY | 20 | | I29 HWY | 10 | | DOGWOOD AVE | 8 | | SALEM ST | 8 | | 16146 140TH STREET | 6 | | 180TH ST | 6 | | 180TH STREET ST | 6 | | 190TH ST | 6 | | BUTLER ST | 6 | | HIGHWAY 141 | 6 | | 11TH ST | 4 | | 170TH ST | 4 | | 190TH STREET ST | 4 | | BERRY AVE | 4 | | CASHEW AVE | 4 | | CORK AVE | 4 | | E-16 | 4 | | E-24 160TH STREET ST | 4 | | I29 FWY | 4 | | K42 HWY | 4 | | SHANNON DRIVE DR | 4 | | STROUD AVE | 4 |
| | | Fire incidents reported |
|---|
| Sreet name | Count |
|---|
| 110TH ST | 2 | | 115TH ST | 2 | | 120TH ST | 2 | | 12724 HWY K42 | 2 | | 130 SHANNON DRIVE | 2 | | 135TH ST | 2 | | 140 MAPLE STREET | 2 | | 140TH STREET ST | 2 | | 14433 CASHEW AVE. | 2 | | 14788 110TH STREET | 2 | | 149 BLAIR STREET | 2 | | 15043 BUCKEYE AVE. | 2 | | 150TH ST | 2 | | 153RD ST | 2 | | 16465 BERRY AVE. | 2 | | 165TH STREET ST | 2 | | 16618 CEDAR AVE. | 2 | | 16627 FILBERT AVE | 2 | | 170TH & HEMLOCK | 2 | | 17132 DOGWOOD AVE | 2 | | 17525 120TH STREET | 2 | | 180 TH STREET | 2 | | 180TH & HEMLOCK | 2 | | 180TH STREET | 2 | | |
|
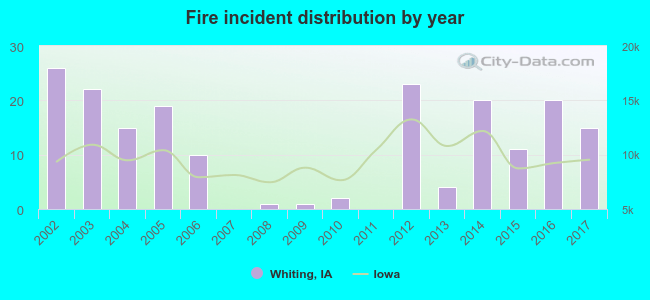 Based on the data from the years 2002 - 2017 the average number of fires per year is 12. The highest number of reported fires - 26 took place in 2002, and the least - 0 in 2007. The data has a declining trend.
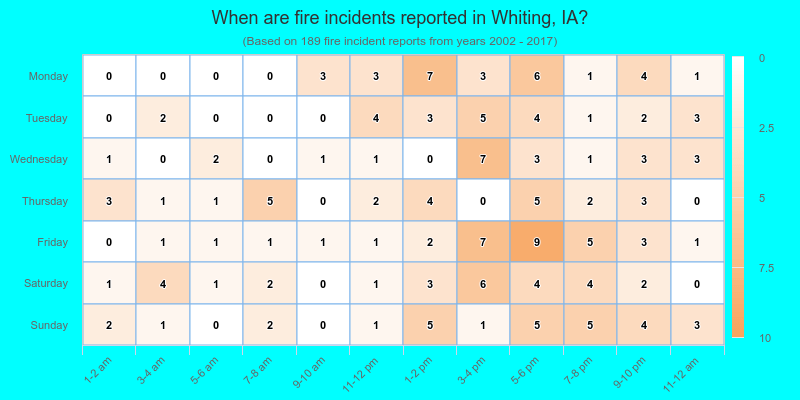
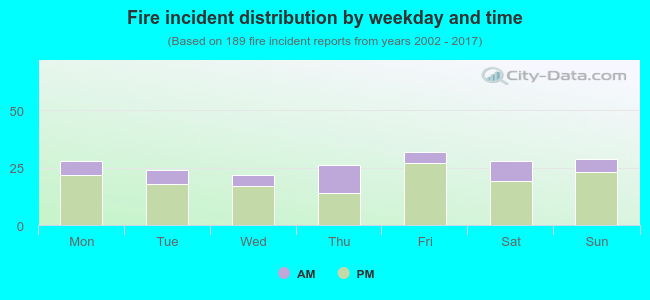 25.9% incidents where reported in the morning and 74.1% in the evening. The most fires (16.9%) took place on Friday, and the least (11.6%) on Wednesday.
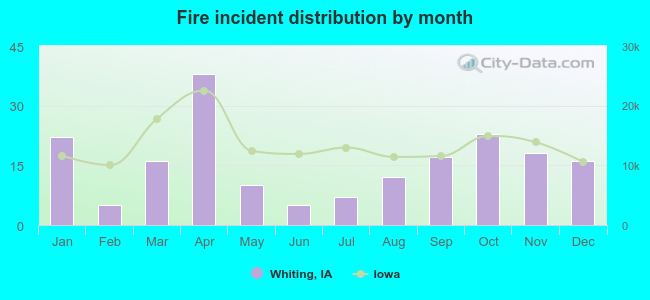 Based on the 189 fire incident reports from years 2002 - 2017 most fires (20.1%) took place during April, and the least (2.6%) in February.
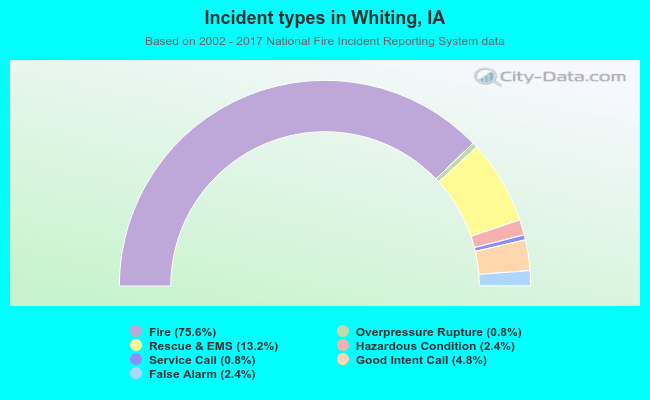 Out of all 250 cases reported during the years 2002 - 2017, the most belonged to the categories: Fire (75.6%), Rescue & EMS (13.2%), and Good Intent Call (4.8%).
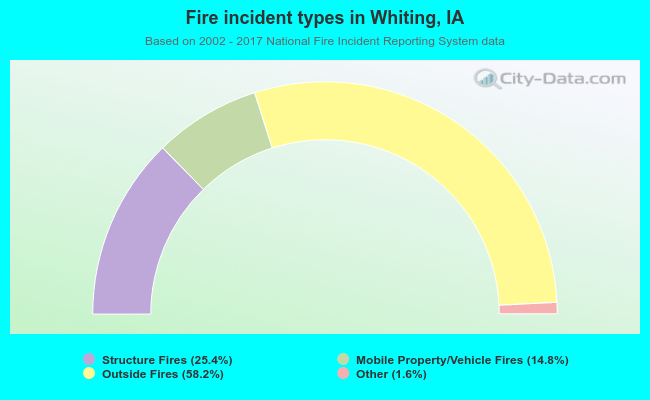 When looking into fire subcategories, the most reports belonged to: Outside Fires (58.2%), and Structure Fires (25.4%).