| Fire incidents reported |
|---|
| Sreet name | Count |
|---|
| 2483 SKIDDY ROAD | 8 | | WOLF RD | 8 | | 1900 & D AVE | 6 | | 2400 ROAD | 6 | | 2700 G AVE | 6 | | 516 S 2200 RD | 6 | | 833 S 2500 RD | 6 | | 1650 PARKERVILLE RD | 4 | | 1700 ROAD | 4 | | 1802 K AVE | 4 | | 2100 F AVE | 4 | | 2100 RD. | 4 | | 2164 WOLF RD | 4 | | 229 S. 2200 RD. | 4 | | 2400 RD. | 4 | | 2483 SKIDDY RD | 4 | | 2600 J AVE | 4 | | 2600 RD. | 4 | | 2700 RD | 4 | | 2753 F AVE | 4 | | 277 S 2100 RD | 4 | | 623 S 2400 RD | 4 | | 6TH & MACKENZIE | 4 | | 722 WEST HARRIS | 4 | | K149 K4 12 MILE WEST | 4 |
| | | Fire incidents reported |
|---|
| Sreet name | Count |
|---|
| MULBERRY | 4 | | WEST OF 2400 G AVE | 4 | | 100 BLOCK OF 2200 RD | 2 | | 103 WEST KANSAS ST | 2 | | 111 W STOVER | 2 | | 1110 SOUTH 2100 RD | 2 | | 1116 S 2400 RD | 2 | | 1116 S2400 ROAD | 2 | | 112 N ADOLPH | 2 | | 112 S. ELM ST | 2 | | 113 GRAND AVE | 2 | | 114 GREEN ACRES | 2 | | 114 W. STOVER ALY | 2 | | 116 W STOCKHOLM | 2 | | 117 S. 2600 RD. | 2 | | 118 S. 2000 RD. | 2 | | 12 MILE S OF 2000 RD | 2 | | 12 MILES SOUTH ON HIGHWAY | 2 | | 1200 2600 RD | 2 | | 1218 S 2100 RD | 2 | | 122 S. 3RD | 2 | | 1255 S 2700 RD | 2 | | 132 S 2100 RD | 2 | | 1380 J AVE | 2 | | |
|
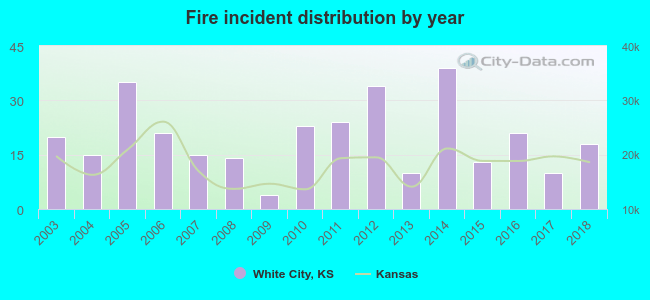 According to the data from the years 2003 - 2018 the average number of fires per year is 20. The highest number of reported fires - 39 took place in 2014, and the least - 4 in 2009. The data has a decreasing trend.
 28.8% incidents where reported in the morning and 71.2% in the evening. The most fires (18.0%) took place on Wednesday, and the least (11.7%) on Friday.
 Based on the 316 fire incidents from years 2003 - 2018 most fires (18.4%) took place during March, and the least (2.8%) in January.
 Out of all 389 cases reported during the years 2003 - 2018, the most belonged to the categories: Fire (81.2%), Overpressure Rupture (6.7%), and Rescue & EMS (5.9%).
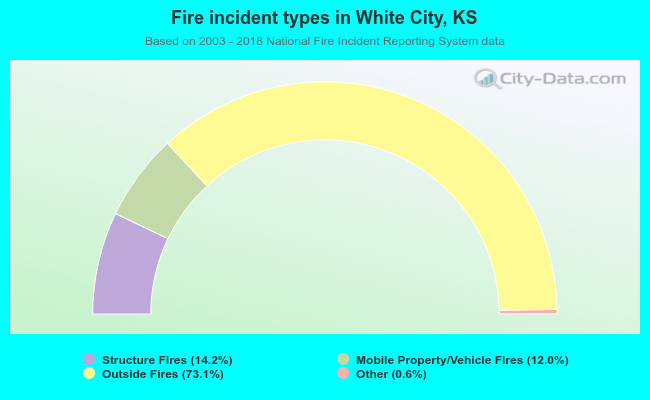 When looking into fire subcategories, the most reports belonged to: Outside Fires (73.1%), and Structure Fires (14.2%).