Weyauwega: Fire Incidents, Wisconsin (WI)
Where are fire incidents reported in Weyauwega, WI
Something went wrong! Please refresh the page.
|
| |||||||||||||||||||||||||||||||||||||||||||||||||||||||||||||||||||||||||||||||||||||||||||||||||||||||||||||
2004 - 2018 National Fire Incident Reporting System (NFIRS) incidents
- Incident types reported to NFIRS in Weyauwega, WI
- 23943.1%Fire
- 12522.5%Rescue & EMS
- 10719.3%Hazardous Condition
- 335.9%False Alarm
- 325.8%Good Intent Call
- 162.9%Service Call
- 10.2%Overpressure Rupture
- 10.2%Severe Weather
- 10.2%Special Incident
- Fire incident types reported to NFIRS in Weyauwega, WI
- 11347.3%Structure Fires
- 7129.7%Outside Fires
- 3815.9%Mobile Property/Vehicle Fires
- 177.1%Other
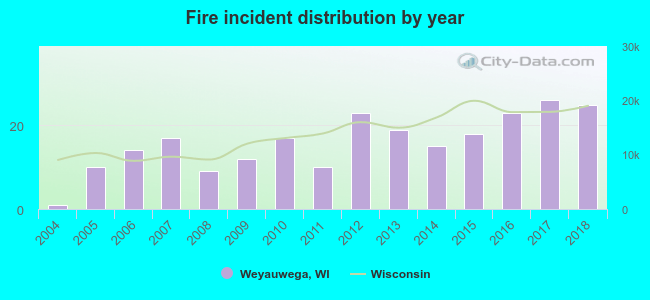 Based on the data from the years 2004 - 2018 the average number of fires per year is 16. The highest number of fire incidents - 26 took place in 2017, and the least - 1 in 2004. The data has a rising trend.
 29.7% incidents where reported in the morning and 70.3% in the evening. The most fires (17.2%) took place on Saturday, and the least (10.5%) on Friday.
 According to the 239 fire incidents from years 2004 - 2018 most fires (15.1%) took place during May, and the least (3.8%) in October.
 Out of all 555 cases reported during the years 2004 - 2018, the most belonged to the categories: Fire (43.1%), Rescue & EMS (22.5%), and Hazardous Condition (19.3%).
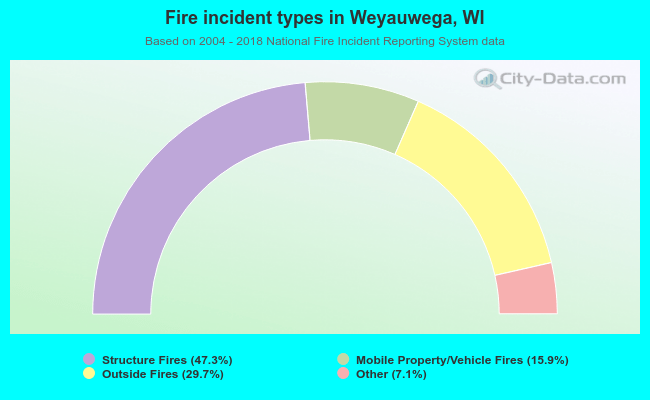 When looking into fire subcategories, the most reports belonged to: Structure Fires (47.3%), and Outside Fires (29.7%).