Westwood: Fire Incidents, Massachusetts (MA)
Where are fire incidents reported in Westwood, MA
Something went wrong! Please refresh the page.
| Fire incidents reported | |
|---|---|
| Sreet name | Count |
| LONGWOOD DR | 662 |
| HIGH ST | 306 |
| UNIVERSITY AVE | 294 |
| WASHINGTON ST | 128 |
| PROVIDENCE HWY | 110 |
| HIGHLAND GLEN RD | 104 |
| CLAPBOARDTREE ST | 96 |
| OUT OF TOWN ST | 94 |
| RT 128 SOUTH HWY | 74 |
| WESTWOOD GLEN RD | 74 |
| CANTON ST | 56 |
| GAY ST | 50 |
| LONGWOOD DRFOX HILLWSWD | 44 |
| NAHATAN ST | 44 |
| LONGWOOD DR | 42 |
| DOVER RD | 38 |
| HARTFORD ST | 38 |
| EAST ST | 34 |
| MARTHA JONES RD | 32 |
| POND ST | 28 |
| RT 128 NORTH HWY | 28 |
| LONGMEADOW DR | 26 |
| BLUE HILL DR | 24 |
| EVERETT ST | 24 |
| FOX HILL ST | 22 |
| OAK ST | 22 |
| CHURCH ST | 20 |
| LONGWOOD DR/FOX HILL/WSWD | 18 |
| WESTWOOD, TOWN OF | 18 |
| CARROLL AVE | 16 |
2002 - 2018 National Fire Incident Reporting System (NFIRS) incidents
- Incident types reported to NFIRS in Westwood, MA
- 7,64846.7%Rescue & EMS
- 2,68416.4%Hazardous Condition
- 2,06012.6%False Alarm
- 1,89811.6%Fire
- 1,3488.2%Service Call
- 7104.3%Good Intent Call
- 250.2%Special Incident
- Fire incident types reported to NFIRS in Westwood, MA
- 1,20263.3%Structure Fires
- 50726.7%Outside Fires
- 1658.7%Mobile Property/Vehicle Fires
- 241.3%Other
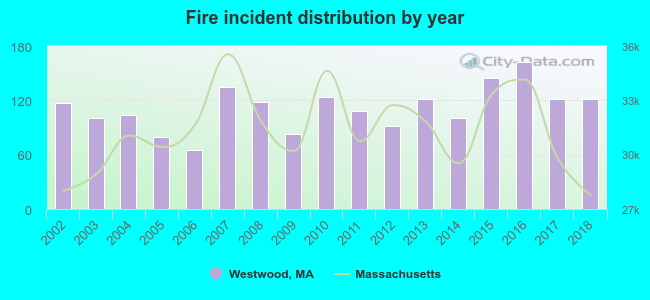 Based on the data from the years 2002 - 2018 the average number of fire incidents per year is 112. The highest number of reported fires - 162 took place in 2016, and the least - 65 in 2006. The data has an increasing trend.
The average number of yearly fire incidents per 10k residents in Westwood, MA compared to nearest cities:
(Note: Based on data for the last 3 years, including only cities with population 5,000 and above)
| Westwood: | 92.1 |
| Norwood: | 40.4 |
| Dedham: | 66.2 |
| Needham: | 17.8 |
| Canton: | 29.2 |
| Medfield: | 29.8 |
| Walpole: | 123.4 |
| Milton: | 54.6 |
| Sharon: | 86.6 |
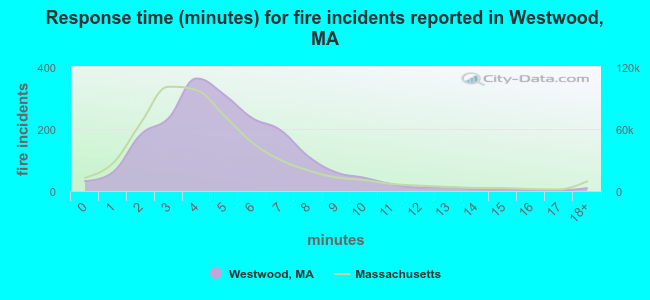 The median response time based on all reported fire incidents is 5 minutes. This is higher than the state median value.
The median response time in Westwood, MA compared to nearest cities:
(Note: Based on data for all years, including only cities with at least 500 fire incidents)
| Westwood: | 5 minutes |
| Norwood: | 4 minutes |
| Dedham: | 4 minutes |
| Needham: | 4 minutes |
| Canton: | 5 minutes |
| Walpole: | 3 minutes |
| Milton: | 3 minutes |
| Sharon: | 5 minutes |
| Wellesley: | 4 minutes |
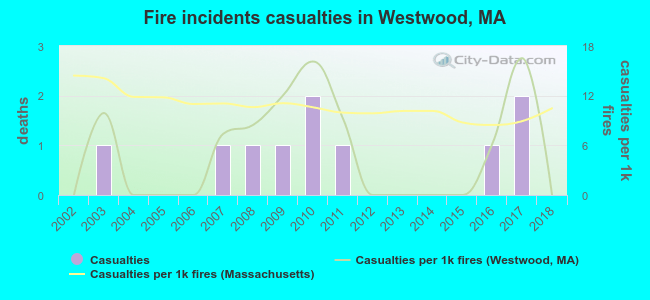 Based on the reports from the years 2002 - 2018 the average number of fire-related casualties per year is 1. The highest number of reported casualties - 2 took place in 2010, and the lowest - 0 in 2002. The data has a constant trend.
The average number of casualties per 1,000 fire incidents is 5. This indicator was the highest - 17 in 2017, and the lowest 0 in 2002. The trend for injuries per 1,000 fire incidents is constant. Compared to the state value the number of injuries per 1,000 fires is much lower.
Based on the reports from the years 2002 - 2018 the average number of fire-related casualties per year is 1. The highest number of reported casualties - 2 took place in 2010, and the lowest - 0 in 2002. The data has a constant trend.
The average number of casualties per 1,000 fire incidents is 5. This indicator was the highest - 17 in 2017, and the lowest 0 in 2002. The trend for injuries per 1,000 fire incidents is constant. Compared to the state value the number of injuries per 1,000 fires is much lower.
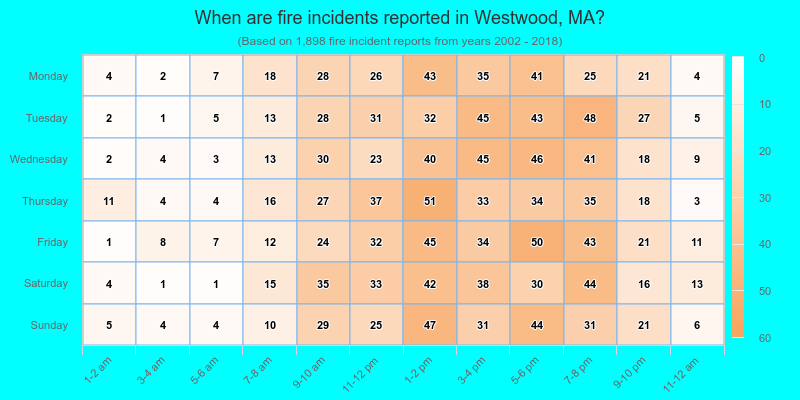
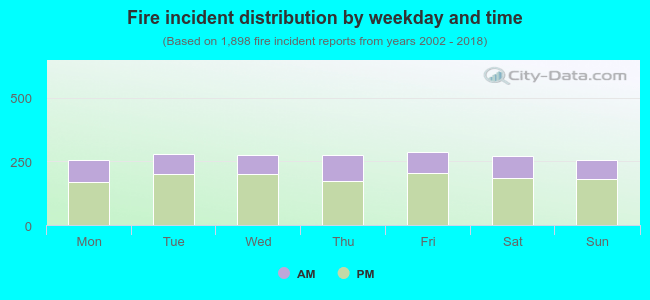 31.0% incidents where reported in the morning and 69.0% in the evening. The most fires (15.2%) took place on Friday, and the least (13.4%) on Monday.
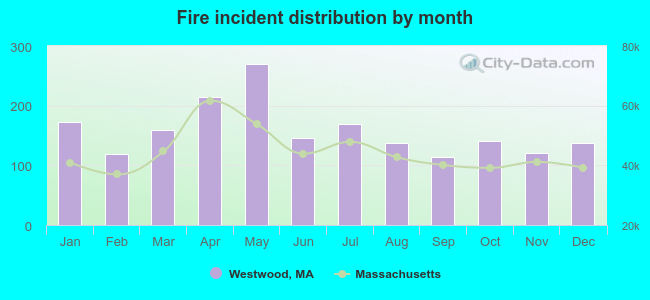 Based on the 1,898 fire incident reports from years 2002 - 2018 most fires (14.2%) took place during May, and the least (6.0%) in September.
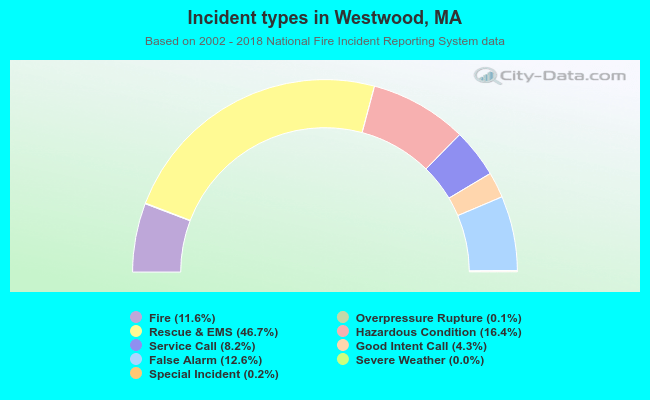 Out of all 16,394 cases reported during the years 2002 - 2018, the most belonged to the categories: Rescue & EMS (46.7%), Hazardous Condition (16.4%), and False Alarm (12.6%).
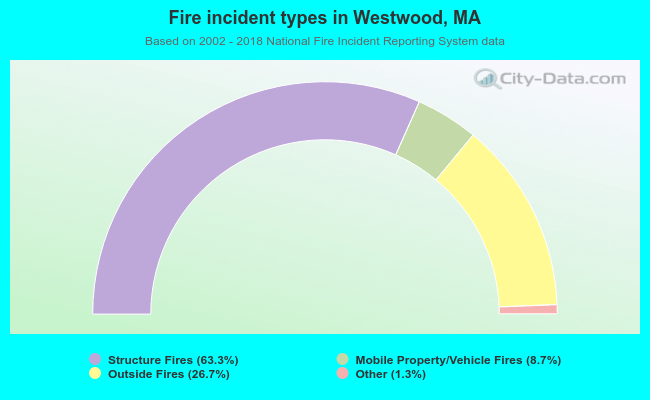 When looking into fire subcategories, the most reports belonged to: Structure Fires (63.3%), and Outside Fires (26.7%).