Westport: Fire Incidents, Indiana (IN)
Where are fire incidents reported in Westport, IN
Something went wrong! Please refresh the page.
|
| |||||||||||||||||||||||||||||||||||||||||||||||||||||||||||||||||||||||||||||||||||||||||||||||||||||||||||||
2002 - 2017 National Fire Incident Reporting System (NFIRS) incidents
- Incident types reported to NFIRS in Westport, IN
- 40041.0%Fire
- 36637.5%Rescue & EMS
- 11111.4%Hazardous Condition
- 545.5%Good Intent Call
- 343.5%Service Call
- 40.4%False Alarm
- 40.4%Severe Weather
- 30.3%Special Incident
- Fire incident types reported to NFIRS in Westport, IN
- 18646.5%Outside Fires
- 15538.8%Structure Fires
- 4611.5%Mobile Property/Vehicle Fires
- 133.3%Other
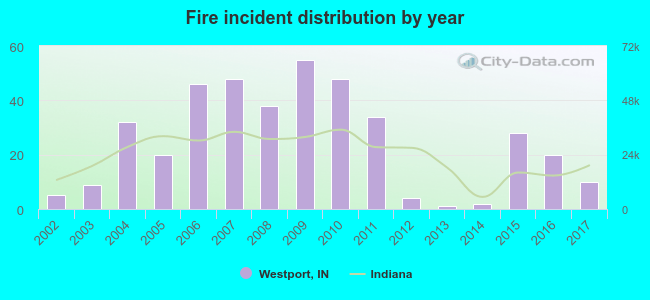 Based on the data from the years 2002 - 2017 the average number of fires per year is 25. The highest number of fires - 55 took place in 2009, and the least - 1 in 2013. The data has a rising trend.
 25.3% incidents where reported in the morning and 74.8% in the evening. The most fires (18.0%) took place on Tuesday, and the least (12.0%) on Thursday.
 Based on the 400 incident reports from years 2002 - 2017 most fires (16.5%) took place during March, and the least (3.8%) in June.
 Out of all 976 cases reported during the years 2002 - 2017, the most belonged to the categories: Fire (41.0%), Overpressure Rupture (37.5%), and Rescue & EMS (11.4%).
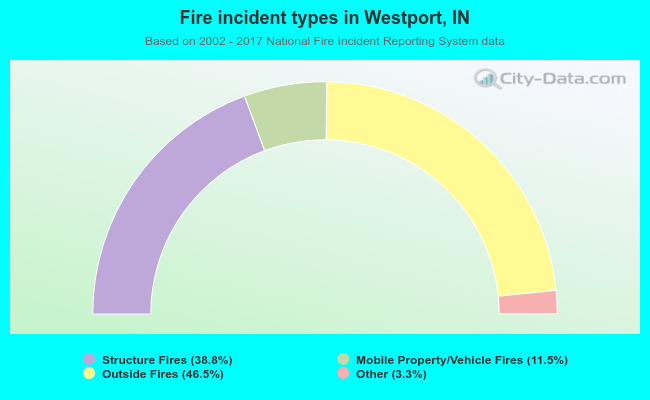 When looking into fire subcategories, the most incidents belonged to: Outside Fires (46.5%), and Structure Fires (38.8%).