Westover: Fire Incidents, West Virginia (WV)
Where are fire incidents reported in Westover, WV
Something went wrong! Please refresh the page.
|
| |||||||||||||||||||||||||||||||||||||||||||||||||||||||||||||||||||||||||||||||||||||||||||||||||||||||||||||
2003 - 2018 National Fire Incident Reporting System (NFIRS) incidents
- Incident types reported to NFIRS in Westover, WV
- 60131.9%Good Intent Call
- 34918.5%Fire
- 30015.9%Hazardous Condition
- 28815.3%Rescue & EMS
- 21911.6%Service Call
- 814.3%False Alarm
- 422.2%Severe Weather
- 30.2%Special Incident
- 20.1%Overpressure Rupture
- Fire incident types reported to NFIRS in Westover, WV
- 23467.0%Structure Fires
- 6418.3%Outside Fires
- 4713.5%Mobile Property/Vehicle Fires
- 41.1%Other
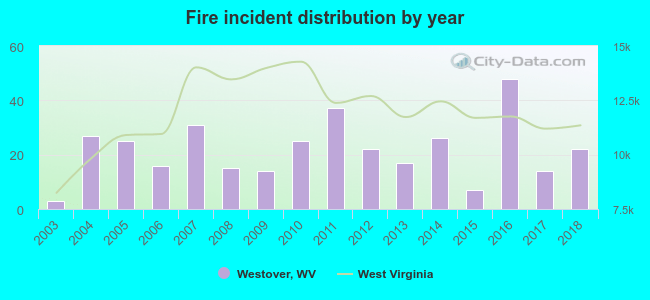 According to the data from the years 2003 - 2018 the average number of fires per year is 22. The highest number of reported fires - 48 took place in 2016, and the least - 3 in 2003. The data has a growing trend.
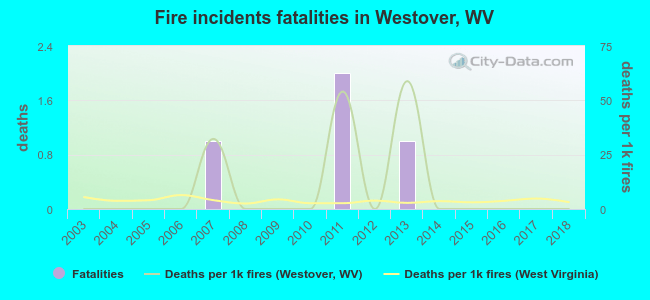 Based on the reports from the years 2003 - 2018 the average number of fire-related fatalities per year is 0. The highest number of reported deaths - 2 took place in 2011, and the lowest - 0 in 2003. The data has a constant trend.
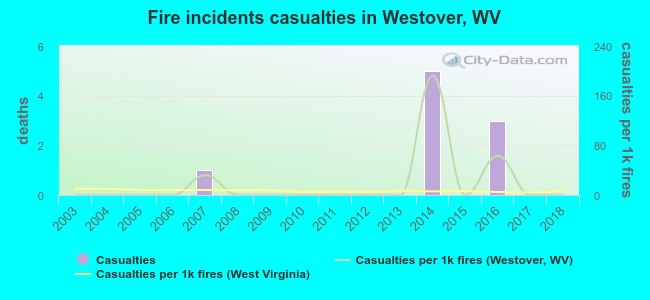 Based on the data from the years 2003 - 2018 the average number of fire-related casualties per year is 1. The highest number of reported casualties - 5 took place in 2014, and the lowest - 0 in 2003. The data has a constant trend.
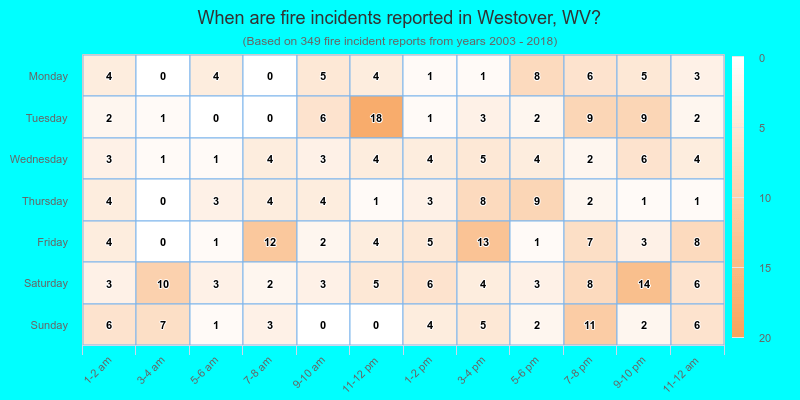
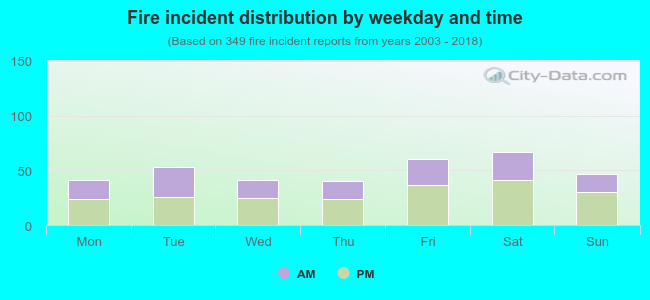 40.7% incidents where reported in the morning and 59.3% in the evening. The most fires (19.2%) took place on Saturday, and the least (11.5%) on Thursday.
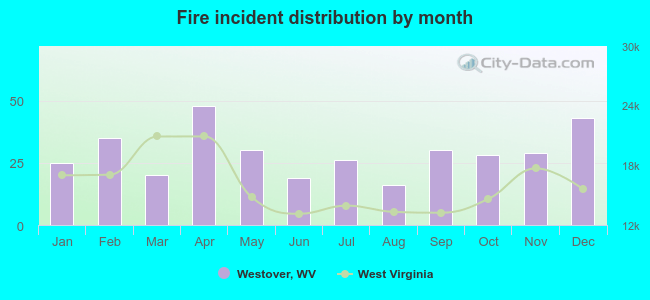 Based on the 349 fire incident reports from years 2003 - 2018 most fires (13.8%) took place during April, and the least (4.6%) in August.
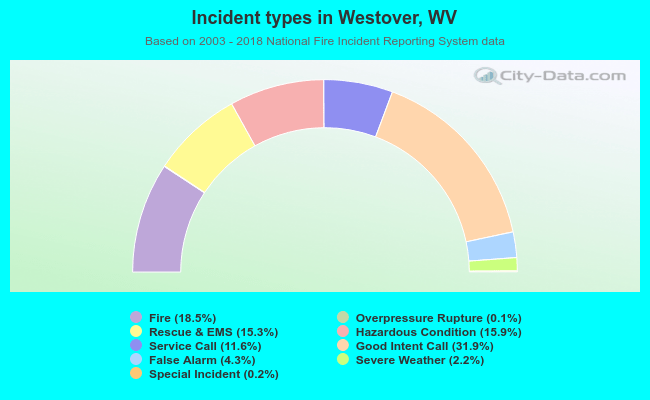 Out of all 1,885 cases reported during the years 2003 - 2018, the most belonged to the categories: Good Intent Call (31.9%), Fire (18.5%), and Hazardous Condition (15.9%).
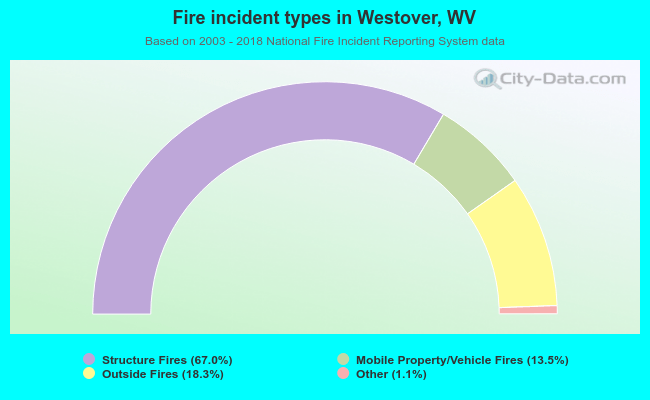 When looking into fire subcategories, the most reports belonged to: Structure Fires (67.0%), and Outside Fires (18.3%).