Westcliffe: Fire Incidents, Colorado (CO)
Where are fire incidents reported in Westcliffe, CO
Something went wrong! Please refresh the page.
|
| |||||||||||||||||||||||||||||||||||||||||||||||||||||||||||||||||||||||||||||||||||||||||||||||||||||||||||||
| Other | 34 | |||||||||||||||||||||||||||||||||||||||||||||||||||||||||||||||||||||||||||||||||||||||||||||||||||||||||||||
2005 - 2018 National Fire Incident Reporting System (NFIRS) incidents
- Incident types reported to NFIRS in Westcliffe, CO
- 59148.2%Hazardous Condition
- 29023.7%Fire
- 15712.8%Good Intent Call
- 897.3%Service Call
- 655.3%Rescue & EMS
- 141.1%False Alarm
- 80.7%Special Incident
- 60.5%Overpressure Rupture
- 50.4%Severe Weather
- Fire incident types reported to NFIRS in Westcliffe, CO
- 18965.2%Outside Fires
- 7425.5%Structure Fires
- 186.2%Other
- 93.1%Mobile Property/Vehicle Fires
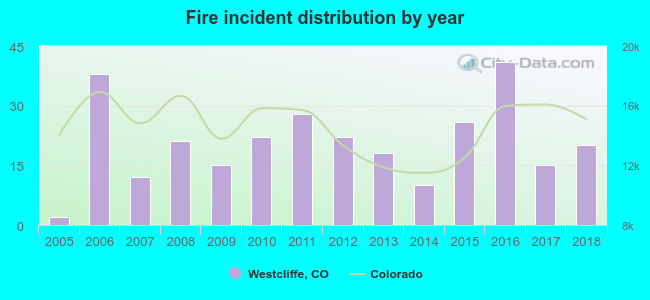 Based on the data from the years 2005 - 2018 the average number of fire incidents per year is 21. The highest number of reported fire incidents - 41 took place in 2016, and the least - 2 in 2005. The data has an increasing trend.
 32.1% incidents where reported in the morning and 67.9% in the evening. The most fires (17.9%) took place on Friday, and the least (11.7%) on Tuesday.
 According to the 290 fire incidents from years 2005 - 2018 most fires (17.6%) took place during June, and the least (2.8%) in September.
 Out of all 1,225 cases reported during the years 2005 - 2018, the most belonged to the categories: Hazardous Condition (48.2%), Fire (23.7%), and Good Intent Call (12.8%).
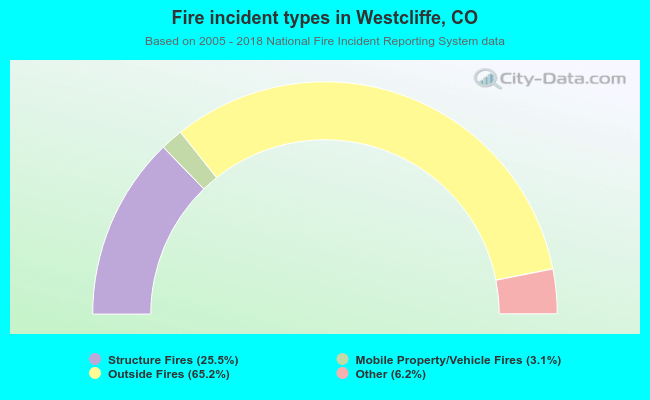 When looking into fire subcategories, the most incidents belonged to: Outside Fires (65.2%), and Structure Fires (25.5%).