West Union: Fire Incidents, Illinois (IL)
Where are fire incidents reported in West Union, IL
Something went wrong! Please refresh the page.
|
| |||||||||||||||||||||||||||||||||||||||||||||||||||||||||||||||||||||||||||||||||||||||||||||||||||||||||||||
2006 - 2018 National Fire Incident Reporting System (NFIRS) incidents
- Incident types reported to NFIRS in West Union, IL
- 11667.1%Fire
- 2011.6%Rescue & EMS
- 1911.0%Hazardous Condition
- 63.5%Special Incident
- 52.9%Good Intent Call
- 42.3%Service Call
- 31.7%False Alarm
- Fire incident types reported to NFIRS in West Union, IL
- 5446.6%Structure Fires
- 4236.2%Outside Fires
- 1714.7%Mobile Property/Vehicle Fires
- 32.6%Other
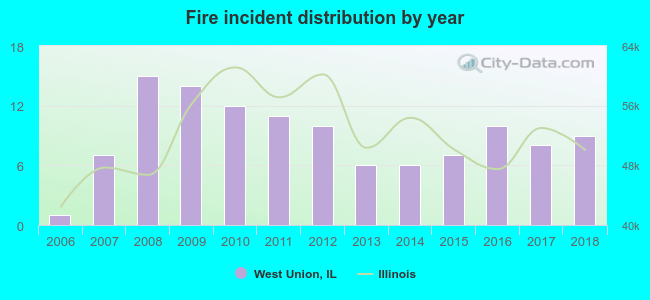 Based on the data from the years 2006 - 2018 the average number of fire incidents per year is 9. The highest number of fire incidents - 15 took place in 2008, and the least - 1 in 2006. The data has a growing trend.
 20.7% incidents where reported in the morning and 79.3% in the evening. The most fires (19.0%) took place on Friday, and the least (7.8%) on Thursday.
 Based on the 116 fire incident reports from years 2006 - 2018 most fires (12.9%) took place during March, and the least (1.7%) in July.
 Out of all 173 cases reported during the years 2006 - 2018, the most belonged to the categories: Fire (67.1%), Overpressure Rupture (11.6%), and Rescue & EMS (11.0%).
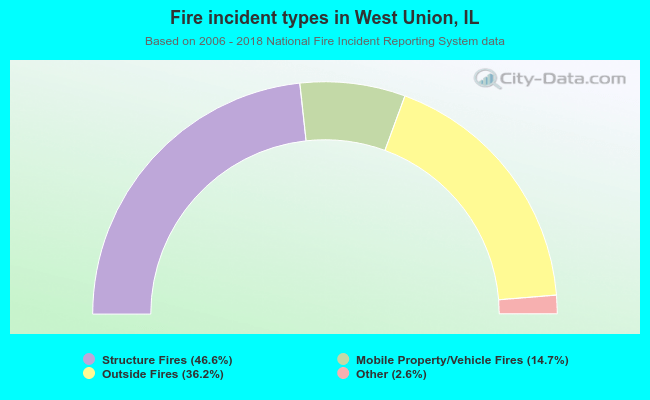 When looking into fire subcategories, the most incidents belonged to: Structure Fires (46.6%), and Outside Fires (36.2%).