| Fire incidents reported |
|---|
| Sreet name | Count |
|---|
| 800 WEST AVE N | 12 | | W4469 GILLS COULEE RD | 8 | | 434 GARLAND ST E | 6 | | 440 COMMERCE ST | 6 | | 120 HARMONY ST S | 4 | | 165 MILL ST S | 4 | | 304 LINCOLN AVE N | 4 | | 507 JEFFERSON ST E | 4 | | 600 BRICKL RD | 4 | | 83 BUOL RD | 4 | | COUNTY M HWY | 4 | | GARLAND ST | 4 | | GILLS COULEE RD RINIKER RD | 4 | | N3305 COUNTY ROAD M | 4 | | N4974 BRIARCLIFFE CT | 4 | | N4985 COUNTY ROAD M | 4 | | N5317 LAKE RD | 4 | | W3108 STATE ROAD 16 | 4 | | 1035 HARTER CT | 2 | | 104 ACORN LN | 2 | | 106 GARLAND ST E | 2 | | 1061 WILLIAM AVE | 2 | | 108 HWY | 2 | | 116 HAMILTON ST W | 2 | | 120 KENS LN | 2 |
| | | Fire incidents reported |
|---|
| Sreet name | Count |
|---|
| 124 BOUL RD | 2 | | 126 FRANKLIN ST W | 2 | | 126 RHYME ST | 2 | | 129 HARMONY ST N | 2 | | 132 RHYME ST | 2 | | 134 HAMLIN ST W | 2 | | 1425 CITY HIGHWAY 16 W | 2 | | 144 OAK AVE S | 2 | | 16 HWY | 2 | | 166 S. MILL | 2 | | 167 HARMONY ST S | 2 | | 170 WEST AVE S | 2 | | 171 OAK AVE S | 2 | | 205 JEFFERSON ST E | 2 | | 222 HAMILTON ST W | 2 | | 2301 CITY HIGHWAY 16 W | 2 | | 284 LARK LN | 2 | | 321 WAGON DR | 2 | | 321 WAGON DR APT #429 | 2 | | 331 MILL ST N | 2 | | 35 COUNTY ROAD OA | 2 | | 365 S. OAK | 2 | | 405 HAMLIN ST EAST | 2 | | 430 LYNN DRIVE ST | 2 | | 431 MILL ST S | 2 |
|
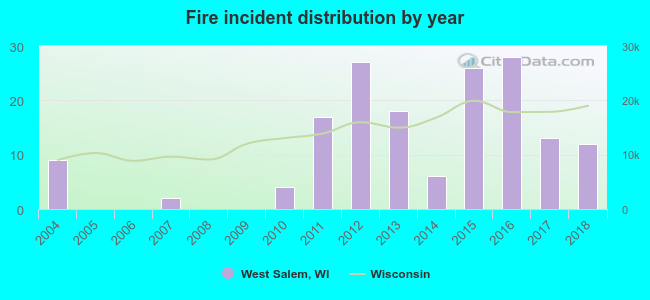 Based on the data from the years 2004 - 2018 the average number of fires per year is 11. The highest number of reported fire incidents - 28 took place in 2016, and the least - 0 in 2005. The data has an increasing trend.

 32.1% incidents where reported in the morning and 67.9% in the evening. The most fires (18.5%) took place on Saturday, and the least (8.0%) on Tuesday.
 Based on the 162 fires from years 2004 - 2018 most fires (17.3%) took place during April, and the least (5.6%) in January.
 Out of all 594 cases reported during the years 2004 - 2018, the most belonged to the categories: Rescue & EMS (29.1%), Fire (27.3%), and Good Intent Call (19.5%).
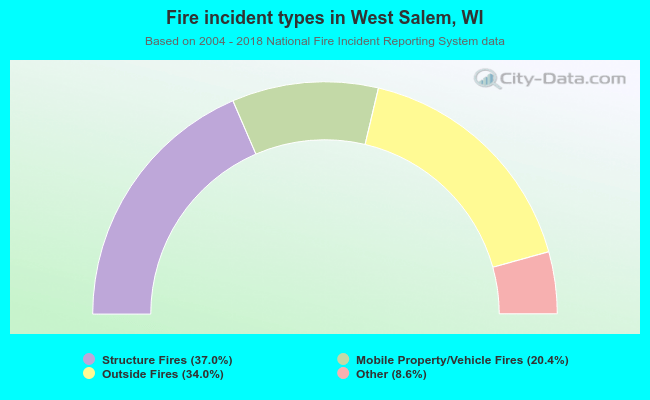 When looking into fire subcategories, the most incidents belonged to: Structure Fires (37.0%), and Outside Fires (34.0%).