| Fire incidents reported |
|---|
| Sreet name | Count |
|---|
| 640 RD | 8 | | 400 RD | 6 | | WABASH 20 AVE | 6 | | 1850 CORD 238 | 4 | | 1950 BLVD | 4 | | 22735 EAST 640 ROAD | 4 | | 300 EAST / 1750 NORTH | 4 | | 358 NORTH WEST STREET | 4 | | 407 SOUTH LOCUST STREET | 4 | | 506 WEST CHURCH STREET | 4 | | 850 NORTH 825 EAST | 4 | | CR1850N RD | 4 | | CR800E | 4 | | HIGHWAY 11 | 4 | | HIGHWAY 11 HWY | 4 | | # 10 FRIENDLY ACRES | 2 | | 1000 EAST CO RD 1750 NORTH | 2 | | 101 WEST NORTH STREET | 2 | | 1019 CO RD1900 NORTH | 2 | | 105 EAST MAIN | 2 | | 1050 EAST / 200 NORTH | 2 | | 108 SOUTH ALBION STREET | 2 | | 150 EAST CORD 125 EAST | 2 | | 1600 NORTH 500 EAST | 2 | | 1600 NORTH 700 EAST | 2 |
| | | Fire incidents reported |
|---|
| Sreet name | Count |
|---|
| 1650 CO RD825 EAST | 2 | | 1650 NORTH 775 EAST | 2 | | 1650 NORTH CO RD 700 EAST | 2 | | 1700 NORTH WABASH CO RD | 2 | | 1750 NORTH / 1000 EAST | 2 | | 1775 NORTH / 750 EAST | 2 | | 1800 NORTH / 725 EAST | 2 | | 1800 NORTH / 850 EAST | 2 | | 18250 NORTH/700 EAST | 2 | | 1839 COUNTY RD850 EAST | 2 | | 1850 NORTH | 2 | | 1850 NORTH 200 EAST | 2 | | 1850 NORTH 500 EAST | 2 | | 1850 NORTH CORD 500 EAST | 2 | | 1850 NORTH4 EAST | 2 | | 1860 N CO RD 500 E | 2 | | 1863 IL RT130 | 2 | | 1900 NORTH / 850 EAST | 2 | | 1900 NORTH 950 EAST | 2 | | 1900 NORTH CO RD 850 EAST | 2 | | 1906 CO RD700 EAST LGTS | 2 | | 1940 CO RD300 WEST | 2 | | 1940 NORTH CORD 300 EAST | 2 | | 1970 BLVD | 2 | | |
|
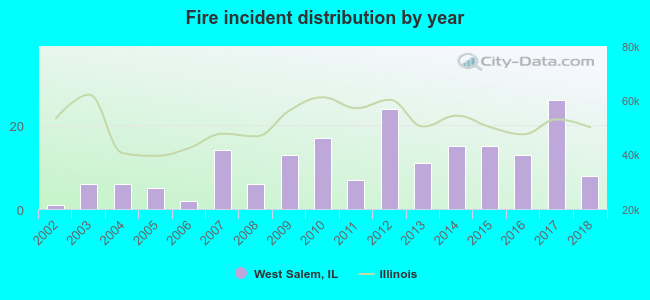 Based on the data from the years 2002 - 2018 the average number of fire incidents per year is 11. The highest number of fire incidents - 26 took place in 2017, and the least - 1 in 2002. The data has a growing trend.
 30.2% incidents where reported in the morning and 69.8% in the evening. The most fires (18.5%) took place on Monday, and the least (9.5%) on Friday.
 Based on the 189 fire incident reports from years 2002 - 2018 most fires (19.0%) took place during September, and the least (5.3%) in July.
 Out of all 268 cases reported during the years 2002 - 2018, the most belonged to the categories: Fire (70.5%), Overpressure Rupture (16.8%), and Hazardous Condition (4.9%).
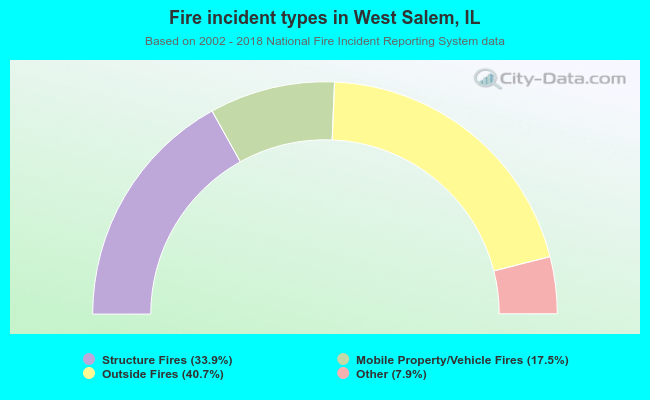 When looking into fire subcategories, the most incidents belonged to: Outside Fires (40.7%), and Structure Fires (33.9%).