West Peoria: Fire Incidents, Illinois (IL)
Where are fire incidents reported in West Peoria, IL
Something went wrong! Please refresh the page.
|
| |||||||||||||||||||||||||||||||||||||||||||||||||||||||||||||||||||||||||||||||||||||||||||||||||||||||||||||
2005 - 2018 National Fire Incident Reporting System (NFIRS) incidents
- Incident types reported to NFIRS in West Peoria, IL
- 1,81267.0%Rescue & EMS
- 2629.7%Fire
- 2047.5%Hazardous Condition
- 1947.2%Good Intent Call
- 1355.0%Service Call
- 913.4%False Alarm
- 30.1%Overpressure Rupture
- Fire incident types reported to NFIRS in West Peoria, IL
- 13250.4%Structure Fires
- 10238.9%Outside Fires
- 249.2%Mobile Property/Vehicle Fires
- 41.5%Other
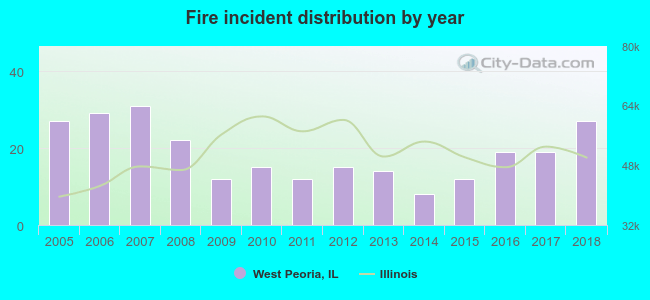 Based on the data from the years 2005 - 2018 the average number of fire incidents per year is 19. The highest number of fire incidents - 31 took place in 2007, and the least - 8 in 2014. The data has a constant trend.
 According to the data from the years 2005 - 2018 the average number of fire-related casualties per year is 0. The highest number of reported injuries - 2 took place in 2010, and the lowest - 0 in 2006. The data has a declining trend.
 29.4% incidents where reported in the morning and 70.6% in the evening. The most fires (19.5%) took place on Sunday, and the least (11.8%) on Tuesday.
 Based on the 262 reports from years 2005 - 2018 most fires (11.8%) took place during November, and the least (5.7%) in February.
 Out of all 2,705 cases reported during the years 2005 - 2018, the most belonged to the categories: Rescue & EMS (67.0%), Fire (9.7%), and Hazardous Condition (7.5%).
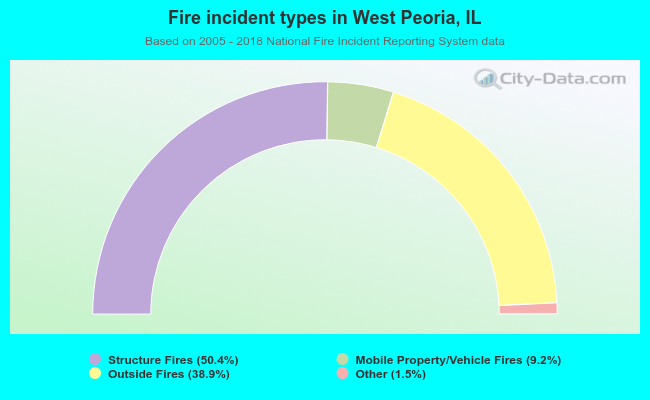 When looking into fire subcategories, the most reports belonged to: Structure Fires (50.4%), and Outside Fires (38.9%).