| Fire incidents reported |
|---|
| Sreet name | Count |
|---|
| PALISADES CENTER DR | 54 | | STRAWTOWN RD | 28 | | DEMAREST MILL RD | 20 | | PALISADES CENTER DR | 16 | | PARROTT RD | 12 | | FOXWOOD RD | 10 | | PARROTT RD | 8 | | ROCKFORD DR | 8 | | STRAWTOWN RD | 8 | | BROOKHILL DR | 6 | | GERMONDS RD | 6 | | KLEIN AVE | 6 | | NYACK RD | 6 | | RICHARD DR | 6 | | S ROUTE 303 | 6 | | SICKLETOWN RD | 6 | | STONE HAVEN RD | 6 | | 287NEW YORK STATE THWY | 4 | | 303 | 4 | | 59 | 4 | | CARDINAL CT | 4 | | CONTINENTAL DR | 4 | | DEMAREST AVE | 4 | | JILL DR | 4 | | MARYCREST RD | 4 |
| | | Fire incidents reported |
|---|
| Sreet name | Count |
|---|
| PALISADES CENTER | 4 | | PALISADES CENTER DR. | 4 | | PERTH CT | 4 | | S GREENBUSH RD | 4 | | SAMANTHA WAY | 4 | | SNAKE HILL RD | 4 | | STONY HILL LN | 4 | | TALL PINES CT | 4 | | WEST NYACK RD | 4 | | WEST NYACK ROAD | 4 | | 287RAMP NEW YORK STATE THWY | 2 | | ABERDEEN DR | 2 | | ALEX CT | 2 | | AMETHYST CT | 2 | | AVNER LN | 2 | | BENSON AVE | 2 | | BOBWHITE LN | 2 | | BROOKDALE COURT | 2 | | BROOKDALE CT | 2 | | BROOKDALE CT | 2 | | BROOKDALE CT. | 2 | | BULL RUN | 2 | | DEMAREST | 2 | | DEMAREST MILL CT | 2 | | DEMERAST MILL RD | 2 |
|
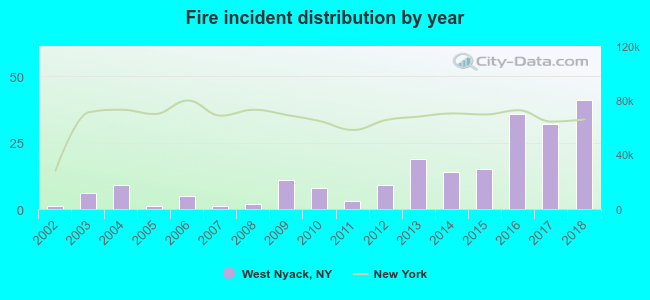 Based on the data from the years 2002 - 2018 the average number of fires per year is 13. The highest number of fires - 41 took place in 2018, and the least - 1 in 2002. The data has an increasing trend.
 23.5% incidents where reported in the morning and 76.5% in the evening. The most fires (18.8%) took place on Sunday, and the least (10.8%) on Monday.
 Based on the 213 fire incident reports from years 2002 - 2018 most fires (12.2%) took place during August, and the least (5.2%) in March.
 Out of all 2,126 cases reported during the years 2002 - 2018, the most belonged to the categories: False Alarm (37.0%), Hazardous Condition (27.5%), and Good Intent Call (11.8%).
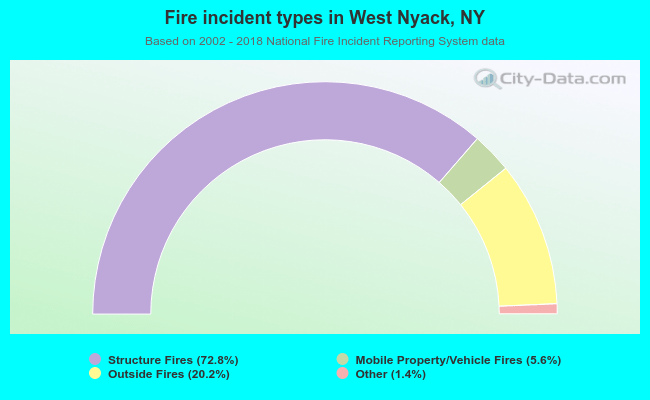 When looking into fire subcategories, the most incidents belonged to: Structure Fires (72.8%), and Outside Fires (20.2%).