| Fire incidents reported |
|---|
| Sreet name | Count |
|---|
| CHESTNUT ST | 12 | | I39 | 12 | | INTERSTATE 39 | 10 | | SPRUCE ST | 10 | | CHESTNUT | 8 | | CHESTNUT ST | 8 | | BIRCH ST | 6 | | RT 251 | 6 | | CHESTNUT STREET | 4 | | EAST 9TH RD | 4 | | I39 HWY | 4 | | LOCUST | 4 | | MAIN AND RT 17 | 4 | | RR1 | 4 | | ST RT 251 | 4 | | 0725 E 3000 RD | 2 | | 1002 EAST 12TH RD | 2 | | 114 BRYCH | 2 | | 130 SPRUCE ST | 2 | | 1881 MERIDIAN ROAD | 2 | | 1ST NORTH STREET | 2 | | 1ST SOUTH | 2 | | 200 BLOCK S LOCUST ST | 2 | | 204 W 2ND | 2 | | 204 W SOUTH ST | 2 |
| | | Fire incidents reported |
|---|
| Sreet name | Count |
|---|
| 206 NORHT CHESTNUT ST | 2 | | 209 S. HICKORY | 2 | | 210 CHESTNUT | 2 | | 213 N WALNUT | 2 | | 213 SPRUCE ST | 2 | | 214 S CHESTNUT | 2 | | 2500E EVANS RD | 2 | | 2700 RD | 2 | | 2783 ROAD | 2 | | 2900 S AND RT 17 | 2 | | 3000 E | 2 | | 3000 EAST | 2 | | 3000 ECR AND BNSF TRACKS | 2 | | 310 N BIRCH | 2 | | 310 W ELM STREET | 2 | | 310 WEST ELM | 2 | | 3100 N ROAD | 2 | | 3110 N RD | 2 | | 3RD S ST ST | 2 | | 3RD SOUTH | 2 | | 3RD SOUTH AND LOCUST ST | 2 | | 4 CALVARY DRIVE | 2 | | 401 SOUTH OAK STREET | 2 | | 405 W 1ST SOUTH | 2 | | |
|
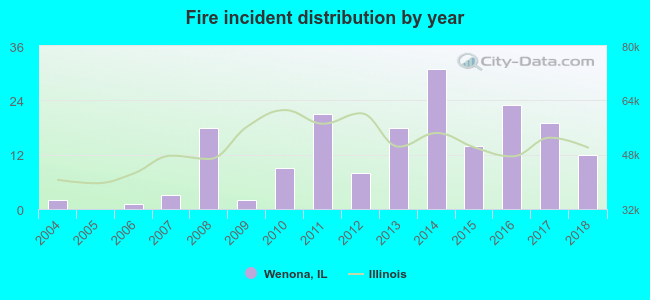 According to the data from the years 2004 - 2018 the average number of fires per year is 12. The highest number of reported fires - 31 took place in 2014, and the least - 0 in 2005. The data has an increasing trend.
 42.5% incidents where reported in the morning and 57.5% in the evening. The most fires (21.0%) took place on Monday, and the least (7.2%) on Wednesday.
 According to the 181 incident reports from years 2004 - 2018 most fires (12.2%) took place during January, and the least (2.2%) in February.
 Out of all 366 cases reported during the years 2004 - 2018, the most belonged to the categories: Fire (49.5%), Rescue & EMS (22.1%), and Good Intent Call (10.1%).
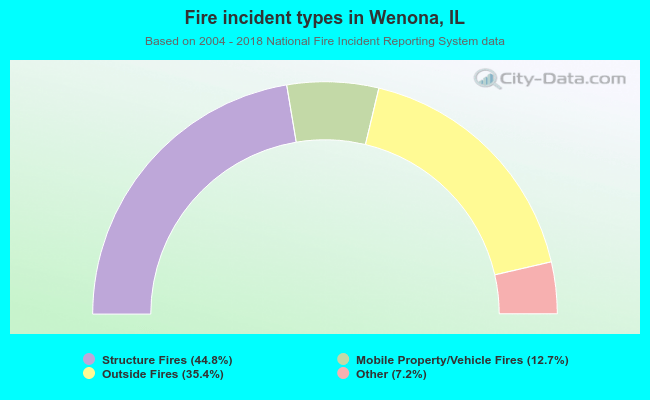 When looking into fire subcategories, the most incidents belonged to: Structure Fires (44.8%), and Outside Fires (35.4%).