Wellston: Fire Incidents, Michigan (MI)
Where are fire incidents reported in Wellston, MI
Something went wrong! Please refresh the page.
|
| |||||||||||||||||||||||||||||||||||||||||||||||||||||||||||||||||||||||||||||||||||||||||||||||||||||||||||||
2003 - 2018 National Fire Incident Reporting System (NFIRS) incidents
- Incident types reported to NFIRS in Wellston, MI
- 41350.2%Rescue & EMS
- 15819.2%Fire
- 15318.6%Hazardous Condition
- 546.6%Service Call
- 293.5%Good Intent Call
- 111.3%False Alarm
- 30.4%Special Incident
- 20.2%Overpressure Rupture
- Fire incident types reported to NFIRS in Wellston, MI
- 7648.1%Structure Fires
- 5836.7%Outside Fires
- 138.2%Mobile Property/Vehicle Fires
- 117.0%Other
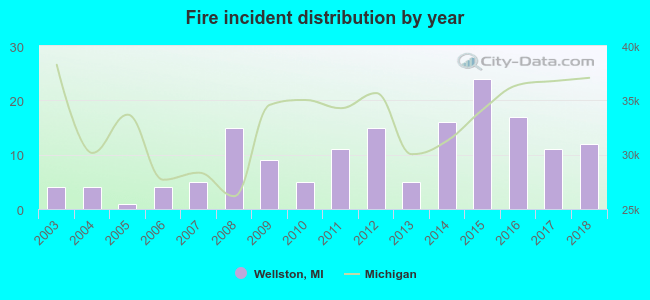 Based on the data from the years 2003 - 2018 the average number of fires per year is 10. The highest number of fire incidents - 24 took place in 2015, and the least - 1 in 2005. The data has an increasing trend.
 25.9% incidents where reported in the morning and 74.1% in the evening. The most fires (18.4%) took place on Thursday, and the least (10.1%) on Tuesday.
 According to the 158 fire incident reports from years 2003 - 2018 most fires (15.2%) took place during May, and the least (2.5%) in August.
 Out of all 823 cases reported during the years 2003 - 2018, the most belonged to the categories: Rescue & EMS (50.2%), Fire (19.2%), and Hazardous Condition (18.6%).
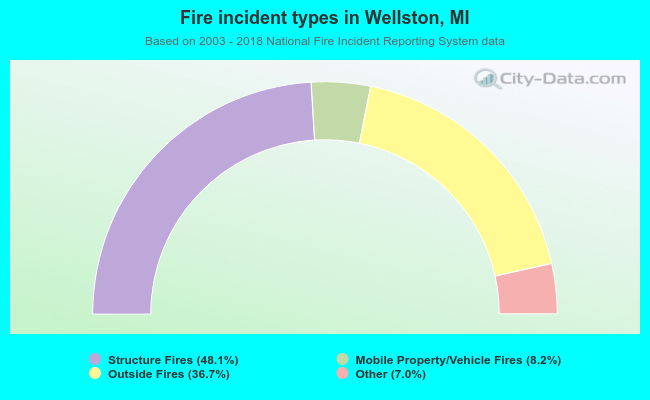 When looking into fire subcategories, the most reports belonged to: Structure Fires (48.1%), and Outside Fires (36.7%).