Weldon: Fire Incidents, North Carolina (NC)
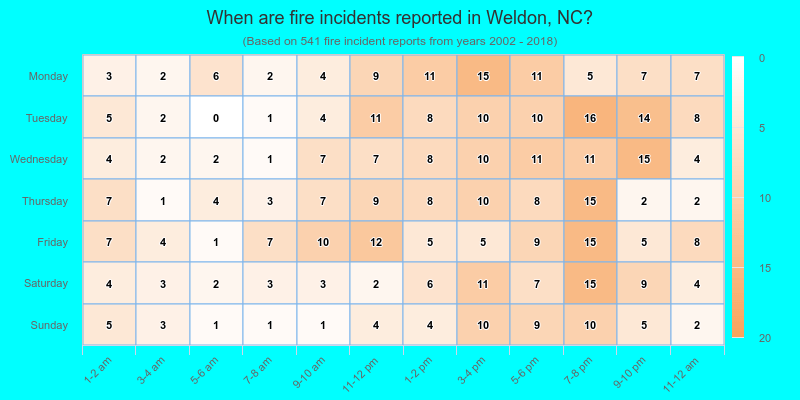
Where are fire incidents reported in Weldon, NC
Something went wrong! Please refresh the page.
|
| |||||||||||||||||||||||||||||||||||||||||||||||||||||||||||||||||||||||||||||||||||||||||||||||||||||||||||||
2002 - 2018 National Fire Incident Reporting System (NFIRS) incidents
- Incident types reported to NFIRS in Weldon, NC
- 2,77965.6%Rescue & EMS
- 54112.8%Fire
- 49211.6%Hazardous Condition
- 1724.1%False Alarm
- 1583.7%Good Intent Call
- 892.1%Service Call
- Fire incident types reported to NFIRS in Weldon, NC
- 20237.3%Other
- 18834.8%Structure Fires
- 9116.8%Outside Fires
- 6011.1%Mobile Property/Vehicle Fires
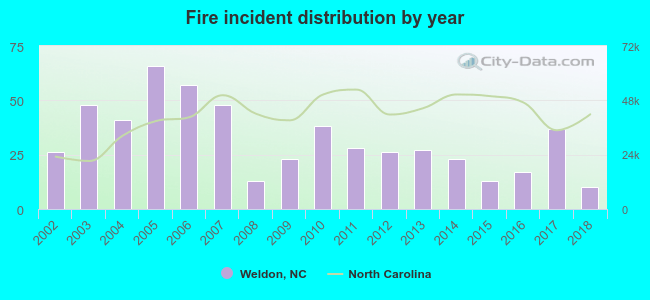 According to the data from the years 2002 - 2018 the average number of fires per year is 32. The highest number of fires - 66 took place in 2005, and the least - 10 in 2018. The data has a decreasing trend.
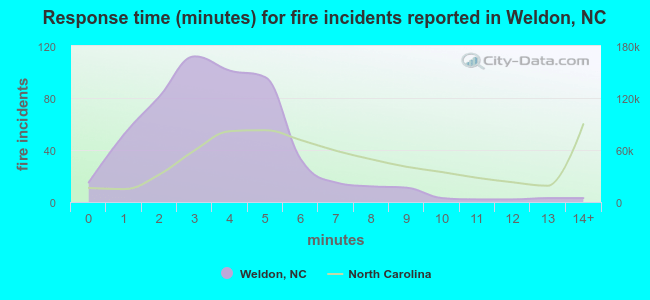 The median response time based on all reported fire incidents is 4 minutes. This is lower compared to the North Carolina median value.
The median response time in Weldon, NC compared to nearest cities:
(Note: Based on data for all years, including only cities with at least 500 fire incidents)
| Weldon: | 4 minutes |
| Roanoke Rapids: | 5 minutes |
| Littleton: | 9 minutes |
| Enfield: | 11 minutes |
| Scotland Neck: | 7 minutes |
| Whitakers: | 12 minutes |
| Rocky Mount: | 5 minutes |
| Ahoskie: | 6 minutes |
| Tarboro: | 5 minutes |
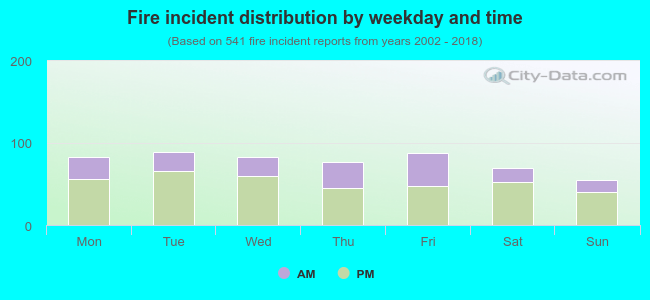 32.5% incidents where reported in the morning and 67.5% in the evening. The most fires (16.5%) took place on Tuesday, and the least (10.2%) on Sunday.
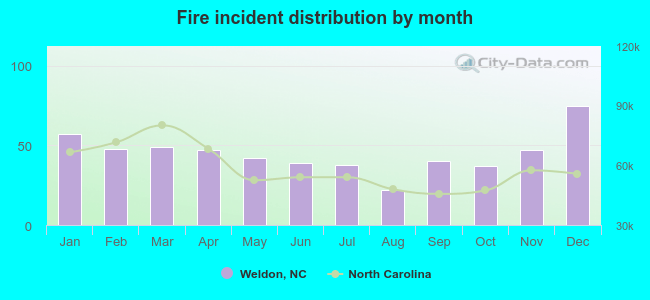 According to the 541 incident reports from years 2002 - 2018 most fires (13.9%) took place during December, and the least (4.1%) in August.
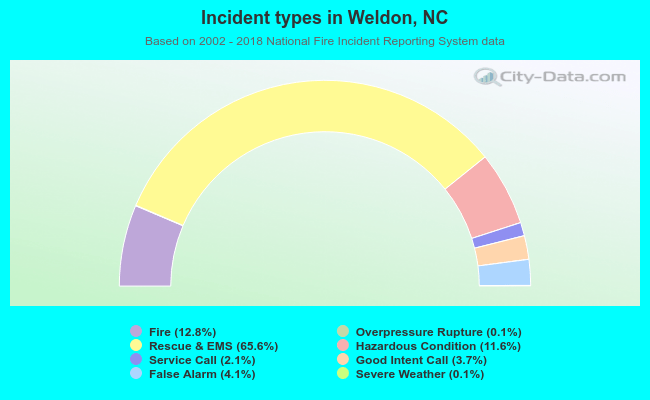 Out of all 4,237 cases reported during the years 2002 - 2018, the most belonged to the categories: Rescue & EMS (65.6%), Fire (12.8%), and Hazardous Condition (11.6%).
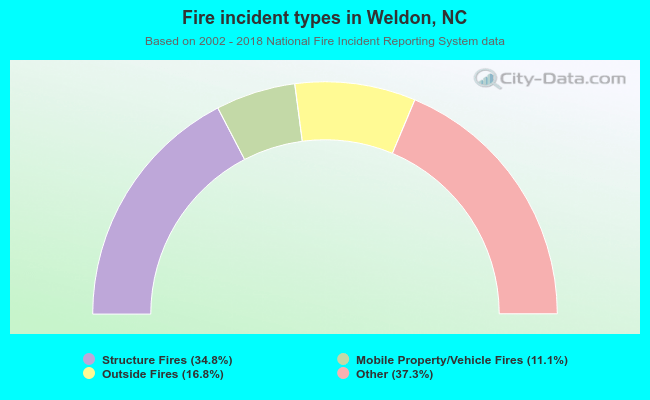 When looking into fire subcategories, the most reports belonged to: Other (37.3%), and Structure Fires (34.8%).