Weidman: Fire Incidents, Michigan (MI)
Where are fire incidents reported in Weidman, MI
Something went wrong! Please refresh the page.
|
| |||||||||||||||||||||||||||||||||||||||||||||||||||||||||||||||||||||||||||||||||||||||||||||||||||||||||||||
2002 - 2018 National Fire Incident Reporting System (NFIRS) incidents
- Incident types reported to NFIRS in Weidman, MI
- 1,34859.8%Rescue & EMS
- 41618.4%Fire
- 24410.8%Hazardous Condition
- 1506.7%Service Call
- 462.0%Good Intent Call
- 331.5%False Alarm
- 90.4%Severe Weather
- 80.4%Special Incident
- Fire incident types reported to NFIRS in Weidman, MI
- 22554.1%Structure Fires
- 10725.7%Outside Fires
- 4310.3%Mobile Property/Vehicle Fires
- 419.9%Other
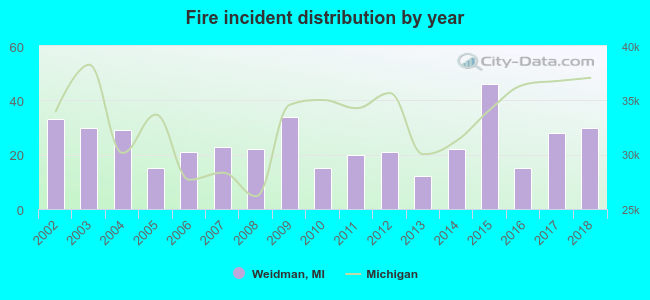 Based on the data from the years 2002 - 2018 the average number of fires per year is 24. The highest number of fire incidents - 46 took place in 2015, and the least - 12 in 2013. The data has a decreasing trend.
 31.7% incidents where reported in the morning and 68.3% in the evening. The most fires (16.6%) took place on Friday, and the least (11.5%) on Sunday.
 According to the 416 fire incident reports from years 2002 - 2018 most fires (16.6%) took place during April, and the least (4.8%) in September.
 Out of all 2,255 cases reported during the years 2002 - 2018, the most belonged to the categories: Rescue & EMS (59.8%), Fire (18.4%), and Hazardous Condition (10.8%).
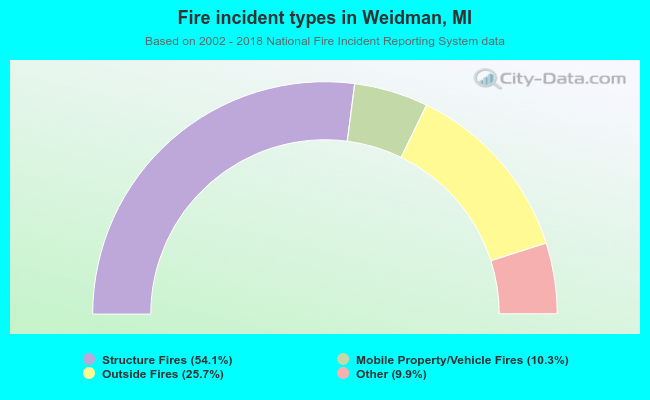 When looking into fire subcategories, the most reports belonged to: Structure Fires (54.1%), and Outside Fires (25.7%).