Webberville: Fire Incidents, Michigan (MI)
Where are fire incidents reported in Webberville, MI
Something went wrong! Please refresh the page.
|
| |||||||||||||||||||||||||||||||||||||||||||||||||||||||||||||||||||||||||||||||||||||||||||||||||||||||||||||
2002 - 2018 National Fire Incident Reporting System (NFIRS) incidents
- Incident types reported to NFIRS in Webberville, MI
- 33036.7%Fire
- 22124.6%Hazardous Condition
- 19421.6%Rescue & EMS
- 808.9%Good Intent Call
- 353.9%Service Call
- 303.3%False Alarm
- 50.6%Overpressure Rupture
- 40.4%Severe Weather
- 10.1%Special Incident
- Fire incident types reported to NFIRS in Webberville, MI
- 18255.2%Structure Fires
- 8525.8%Outside Fires
- 5516.7%Mobile Property/Vehicle Fires
- 82.4%Other
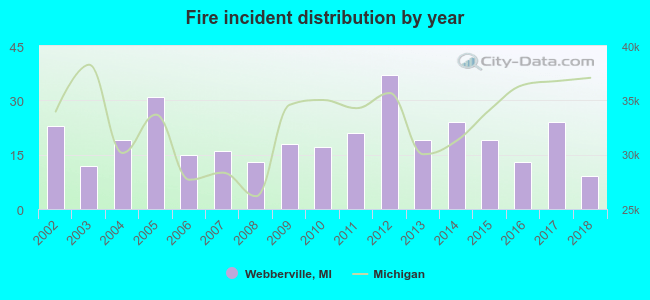 Based on the data from the years 2002 - 2018 the average number of fires per year is 19. The highest number of fire incidents - 37 took place in 2012, and the least - 9 in 2018. The data has a decreasing trend.
 35.8% incidents where reported in the morning and 64.2% in the evening. The most fires (18.8%) took place on Saturday, and the least (10.6%) on Wednesday.
 According to the 330 fire incident reports from years 2002 - 2018 most fires (12.1%) took place during July, and the least (4.8%) in September.
 Out of all 900 cases reported during the years 2002 - 2018, the most belonged to the categories: Fire (36.7%), Hazardous Condition (24.6%), and Rescue & EMS (21.6%).
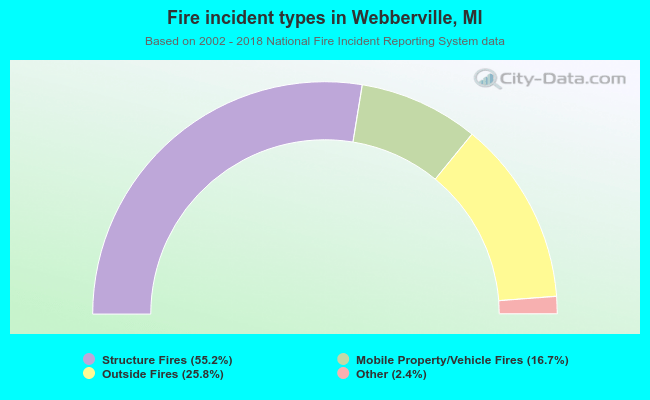 When looking into fire subcategories, the most reports belonged to: Structure Fires (55.2%), and Outside Fires (25.8%).