Weatherly: Fire Incidents, Pennsylvania (PA)
Where are fire incidents reported in Weatherly, PA
Something went wrong! Please refresh the page.
|
| |||||||||||||||||||||||||||||||||||||||||||||||||||||||||||||||||||||||||||||||||||||||||||||||||||||||||||||
2003 - 2018 National Fire Incident Reporting System (NFIRS) incidents
- Incident types reported to NFIRS in Weatherly, PA
- 11649.4%Fire
- 2811.9%Good Intent Call
- 2611.1%Rescue & EMS
- 229.4%Service Call
- 229.4%False Alarm
- 208.5%Hazardous Condition
- 10.4%Severe Weather
- Fire incident types reported to NFIRS in Weatherly, PA
- 9178.4%Structure Fires
- 1412.1%Outside Fires
- 76.0%Mobile Property/Vehicle Fires
- 43.4%Other
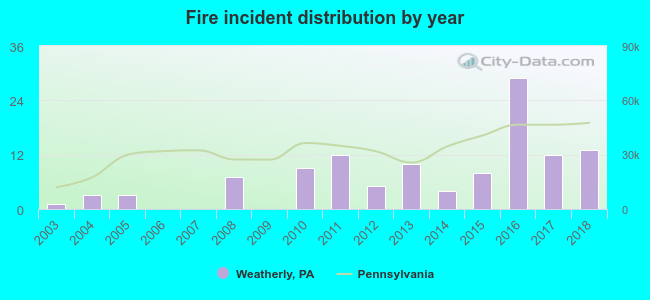 According to the data from the years 2003 - 2018 the average number of fires per year is 7. The highest number of fire incidents - 29 took place in 2016, and the least - 0 in 2006. The data has a rising trend.
 47.4% incidents where reported in the morning and 52.6% in the evening. The most fires (22.4%) took place on Saturday, and the least (6.9%) on Wednesday.
 Based on the 116 fires from years 2003 - 2018 most fires (18.1%) took place during January, and the least (2.6%) in November.
 Out of all 235 cases reported during the years 2003 - 2018, the most belonged to the categories: Fire (49.4%), Service Call (11.9%), and Overpressure Rupture (11.1%).
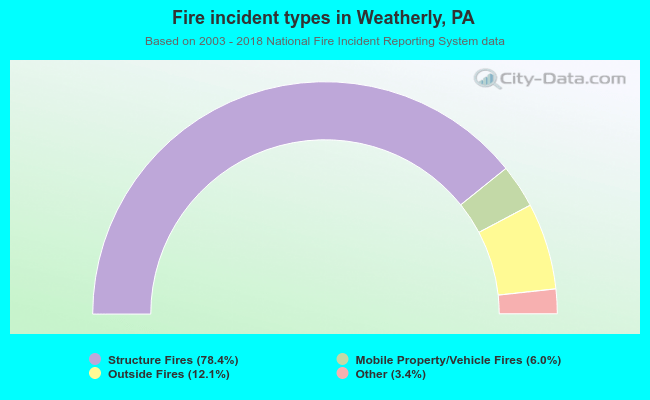 When looking into fire subcategories, the most incidents belonged to: Structure Fires (78.4%), and Outside Fires (12.1%).