Wayne: Fire Incidents, Nebraska (NE)
Where are fire incidents reported in Wayne, NE
Something went wrong! Please refresh the page.
|
| |||||||||||||||||||||||||||||||||||||||||||||||||||||||||||||||||||||||||||||||||||||||||||||||||||||||||||||
| Other | 27 | |||||||||||||||||||||||||||||||||||||||||||||||||||||||||||||||||||||||||||||||||||||||||||||||||||||||||||||
2002 - 2018 National Fire Incident Reporting System (NFIRS) incidents
- Incident types reported to NFIRS in Wayne, NE
- 19752.1%Fire
- 6116.1%False Alarm
- 5614.8%Rescue & EMS
- 236.1%Good Intent Call
- 215.6%Hazardous Condition
- 123.2%Service Call
- 82.1%Severe Weather
- Fire incident types reported to NFIRS in Wayne, NE
- 8342.1%Outside Fires
- 8241.6%Structure Fires
- 199.6%Mobile Property/Vehicle Fires
- 136.6%Other
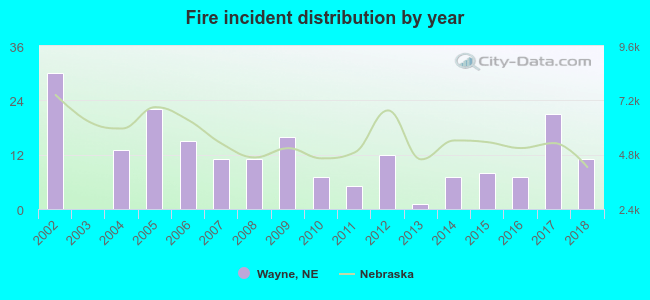 According to the data from the years 2002 - 2018 the average number of fires per year is 12. The highest number of fire incidents - 30 took place in 2002, and the least - 0 in 2003. The data has a declining trend.
The average number of yearly fire incidents per 10k residents in Wayne, NE compared to nearest cities:
(Note: Based on data for the last 3 years, including only cities with population 5,000 and above)
| Wayne: | 23.3 |
| Norfolk: | 31.2 |
| South Sioux City: | 6.7 |

 28.9% incidents where reported in the morning and 71.1% in the evening. The most fires (19.8%) took place on Friday, and the least (10.7%) on Thursday.
 According to the 197 fire incidents from years 2002 - 2018 most fires (19.3%) took place during March, and the least (3.6%) in September.
 Out of all 378 cases reported during the years 2002 - 2018, the most belonged to the categories: Fire (52.1%), Good Intent Call (16.1%), and Overpressure Rupture (14.8%).
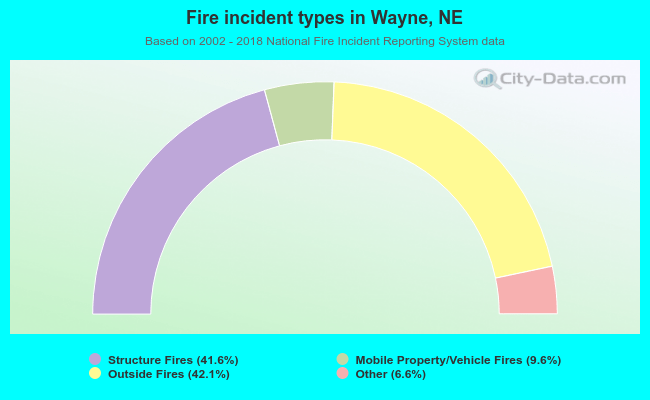 When looking into fire subcategories, the most reports belonged to: Outside Fires (42.1%), and Structure Fires (41.6%).