| Fire incidents reported |
|---|
| Sreet name | Count |
|---|
| INTERSTATE 64 | 28 | | 100 NORTH | 14 | | 600 EAST | 14 | | ADEN ROAD | 10 | | STATE RT 242 | 8 | | 400 NORTH | 6 | | RT 15 | 6 | | RT 242 | 6 | | 1104 WEST SECTION LINE ROAD | 4 | | 1200 NORTH | 4 | | 2300 NORTH | 4 | | 700 NORTH | 4 | | 800 EAST | 4 | | 850 EAST | 4 | | INTERSTATE 64 MILE POST 104 | 4 | | INTERSTATE 64 MILE POST 105 | 4 | | INTERSTATE 64 MILEPOST 96 | 4 | | RT 1 | 4 | | ST RT 242 | 4 | | 000 NORTH | 2 | | 100 BLOCK OF CENTER ALLEY | 2 | | 100 EAST | 2 | | 100 NORTH & 425 EAST | 2 | | 1000 N | 2 | | 1009 WEST ROBINSON | 2 |
| | | Fire incidents reported |
|---|
| Sreet name | Count |
|---|
| 105 E | 2 | | 105 MILE POST, INTERSTATE 64 | 2 | | 107 NORTH MAIN ST | 2 | | 108 CENTER STREET | 2 | | 108 EAST CENTER ST | 2 | | 110 CENTER STREETR | 2 | | 1125 CR 100 N | 2 | | 1200 EAST | 2 | | 125 CR 250N | 2 | | 1350 NORTH | 2 | | 1363 CR 460 EAST | 2 | | 1400 EAST | 2 | | 150 NORTH | 2 | | 151 CR 715E | 2 | | 163 IL HWY 242 | 2 | | 180 EAST | 2 | | 200 N | 2 | | 200 NORTH | 2 | | 200 NORTH MAIN | 2 | | 202 SOUTH MAIN STREET | 2 | | 205 EAST ROBINSON ST | 2 | | 208 EAST MILL ST | 2 | | 230 NORTH | 2 | | 2400 N | 2 | | |
|
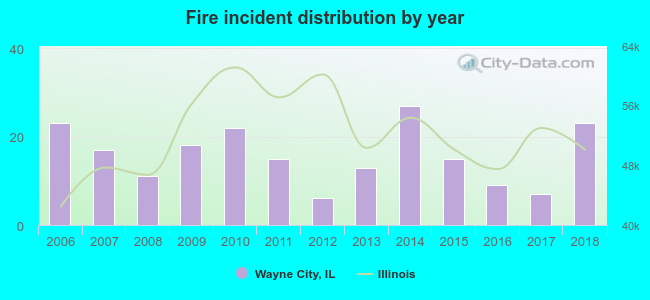 According to the data from the years 2006 - 2018 the average number of fires per year is 16. The highest number of reported fires - 27 took place in 2014, and the least - 6 in 2012. The data has a constant trend.
 26.7% incidents where reported in the morning and 73.3% in the evening. The most fires (18.4%) took place on Friday, and the least (11.2%) on Wednesday.
 Based on the 206 incident reports from years 2006 - 2018 most fires (13.1%) took place during March, and the least (4.4%) in June.
 Out of all 313 cases reported during the years 2006 - 2018, the most belonged to the categories: Fire (65.8%), Rescue & EMS (19.5%), and Service Call (8.3%).
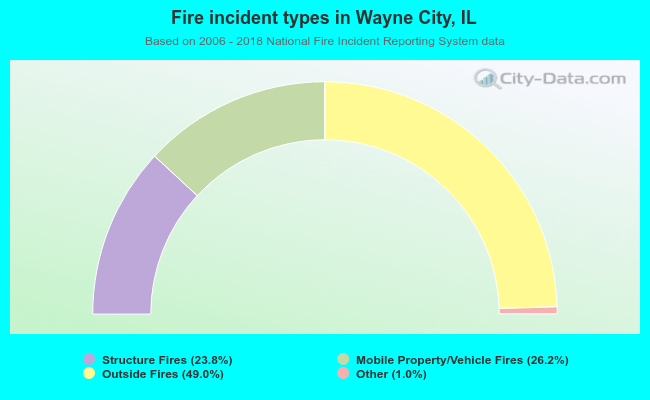 When looking into fire subcategories, the most reports belonged to: Outside Fires (49.0%), and Mobile Property/Vehicle Fires (26.2%).