Wautoma: Fire Incidents, Wisconsin (WI)
Where are fire incidents reported in Wautoma, WI
Something went wrong! Please refresh the page.
|
| |||||||||||||||||||||||||||||||||||||||||||||||||||||||||||||||||||||||||||||||||||||||||||||||||||||||||||||
2002 - 2018 National Fire Incident Reporting System (NFIRS) incidents
- Incident types reported to NFIRS in Wautoma, WI
- 49047.6%Fire
- 22722.1%Rescue & EMS
- 15415.0%Hazardous Condition
- 807.8%False Alarm
- 575.5%Good Intent Call
- 171.7%Service Call
- 30.3%Severe Weather
- Fire incident types reported to NFIRS in Wautoma, WI
- 23147.1%Outside Fires
- 19339.4%Structure Fires
- 5912.0%Mobile Property/Vehicle Fires
- 71.4%Other
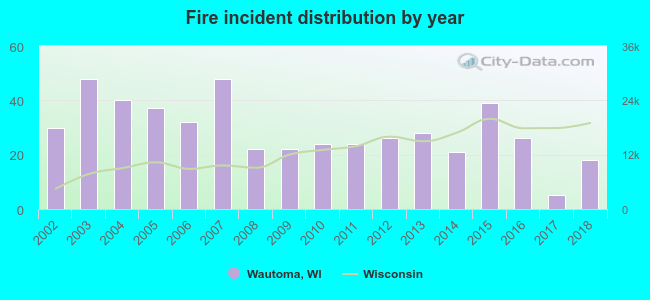 Based on the data from the years 2002 - 2018 the average number of fires per year is 29. The highest number of reported fire incidents - 48 took place in 2003, and the least - 5 in 2017. The data has a decreasing trend.
 31.8% incidents where reported in the morning and 68.2% in the evening. The most fires (19.4%) took place on Saturday, and the least (10.2%) on Thursday.
 Based on the 490 fires from years 2002 - 2018 most fires (17.3%) took place during April, and the least (4.5%) in January.
 Out of all 1,029 cases reported during the years 2002 - 2018, the most belonged to the categories: Fire (47.6%), Rescue & EMS (22.1%), and Hazardous Condition (15.0%).
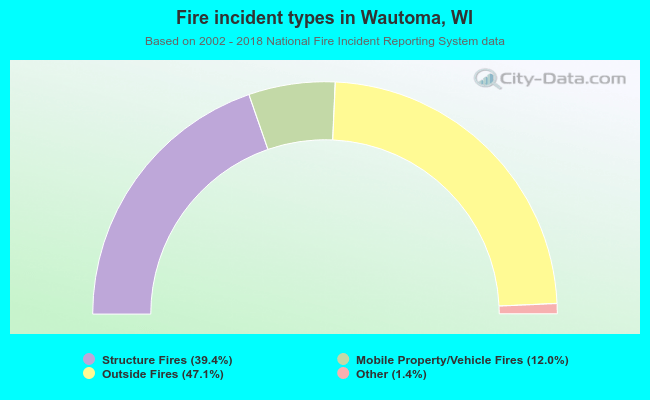 When looking into fire subcategories, the most incidents belonged to: Outside Fires (47.1%), and Structure Fires (39.4%).