Watchung: Fire Incidents, New Jersey (NJ)
Where are fire incidents reported in Watchung, NJ
Something went wrong! Please refresh the page.
|
| |||||||||||||||||||||||||||||||||||||||||||||||||||||||||||||||||||||||||||||||||||||||||||||||||||||||||||||
2004 - 2018 National Fire Incident Reporting System (NFIRS) incidents
- Incident types reported to NFIRS in Watchung, NJ
- 37439.1%Hazardous Condition
- 32934.4%Fire
- 949.8%Rescue & EMS
- 687.1%False Alarm
- 626.5%Good Intent Call
- 252.6%Service Call
- 30.3%Overpressure Rupture
- 10.1%Special Incident
- Fire incident types reported to NFIRS in Watchung, NJ
- 12738.6%Outside Fires
- 11434.7%Structure Fires
- 8124.6%Mobile Property/Vehicle Fires
- 72.1%Other
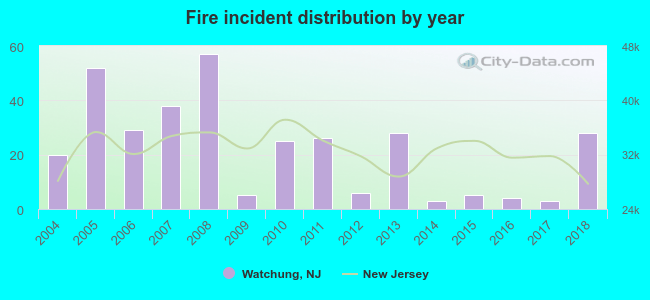 According to the data from the years 2004 - 2018 the average number of fires per year is 22. The highest number of reported fire incidents - 57 took place in 2008, and the least - 3 in 2014. The data has a growing trend.
The average number of yearly fire incidents per 10k residents in Watchung, NJ compared to nearest cities:
(Note: Based on data for the last 3 years, including only cities with population 5,000 and above)
| Watchung: | 19.9 |
| North Plainfield: | 21.8 |
| Plainfield: | 25.8 |
| Berkeley Heights: | 30.8 |
| Fanwood: | 9.6 |
| Dunellen: | 9.0 |
| Scotch Plains: | 31.4 |
| South Plainfield: | 48.3 |
| New Providence: | 16.9 |

 28.3% incidents where reported in the morning and 71.7% in the evening. The most fires (18.2%) took place on Saturday, and the least (10.0%) on Wednesday.
 Based on the 329 fire incidents from years 2004 - 2018 most fires (12.8%) took place during May, and the least (5.8%) in November.
 Out of all 956 cases reported during the years 2004 - 2018, the most belonged to the categories: Hazardous Condition (39.1%), Fire (34.4%), and Rescue & EMS (9.8%).
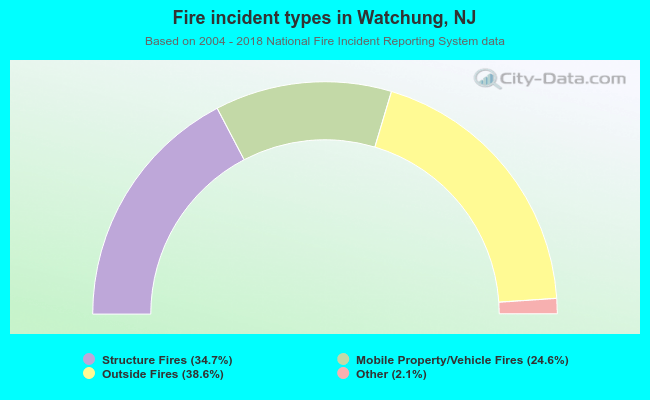 When looking into fire subcategories, the most reports belonged to: Outside Fires (38.6%), and Structure Fires (34.7%).