| Fire incidents reported |
|---|
| Sreet name | Count |
|---|
| DEPOT | 8 | | 545 E. WILLARD ST | 6 | | DEPOT ST | 6 | | 114 N DEPOT | 4 | | 114 N DEPOT ST | 4 | | 1917 KNOX RD 900 E | 4 | | 2015 KNOX RD 600 E | 4 | | 2109 TIMBERVIEW LANE | 4 | | 720 BLAZE RD | 4 | | DEPOT ST | 4 | | I 74 | 4 | | 1000 BLOCK OF CO HWY 7 | 2 | | 1000 E. KNOX CO 7 | 2 | | 1127 KNOX HWY 7 | 2 | | 1150 COUNTY 7 | 2 | | 118 W BURCH ST | 2 | | 1207 KNOX CO HWY 7 | 2 | | 1257 CO 7 | 2 | | 131 E WILLARD ST | 2 | | 138 N. MAIN | 2 | | 1398 KNOX HWY 7 | 2 | | 144 N DEPOT ST | 2 | | 1800 KNOX HWY 7 | 2 | | 1900 BLK OF CO HWY 40 | 2 | | 195 S DEPOT ST | 2 |
| | | Fire incidents reported |
|---|
| Sreet name | Count |
|---|
| 1950 KNOX HWY 40 | 2 | | 1950 KNOX RD CO HWY 40 | 2 | | 1950 KNOX RD 900 E | 2 | | 1958 KNOX RD 900 E | 2 | | 2000 BLOCK OF KNOX HWY 40 | 2 | | 2000 COUNTY 40 | 2 | | 2000 KNOX RD 800 N | 2 | | 2000 N CO HWY 40 | 2 | | 2000 US 34 | 2 | | 201 S DEPOT ST | 2 | | 2021 KNOX RD 700E | 2 | | 203 E. WILLARD ST | 2 | | 2053 KNOX RD 850 E | 2 | | 2053 KNOX RD 850E | 2 | | 2100 HIGHWAY 34 | 2 | | 2112 KNOX HWY 40 | 2 | | 2129 US HWY 150 N | 2 | | 2130 KNOX RD 600 E | 2 | | 214 N UNION ST | 2 | | 2150 KNOX HWY 40 | 2 | | 2172 1050 E | 2 | | 2200 KNOX RD 700 E | 2 | | 221 N DEPOT ST | 2 | | 221 N DEPOT ST LGTS | 2 | | 222 WEST PRAIRIE ST | 2 |
|
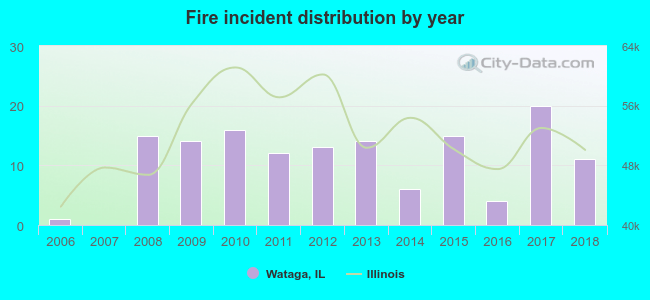 Based on the data from the years 2006 - 2018 the average number of fire incidents per year is 11. The highest number of fires - 20 took place in 2017, and the least - 0 in 2007. The data has an increasing trend.
 15.6% incidents where reported in the morning and 84.4% in the evening. The most fires (21.3%) took place on Tuesday, and the least (8.5%) on Friday.
 According to the 141 fire incident reports from years 2006 - 2018 most fires (19.9%) took place during April, and the least (2.1%) in November.
 Out of all 544 cases reported during the years 2006 - 2018, the most belonged to the categories: Rescue & EMS (40.6%), Fire (25.9%), and Hazardous Condition (21.5%).
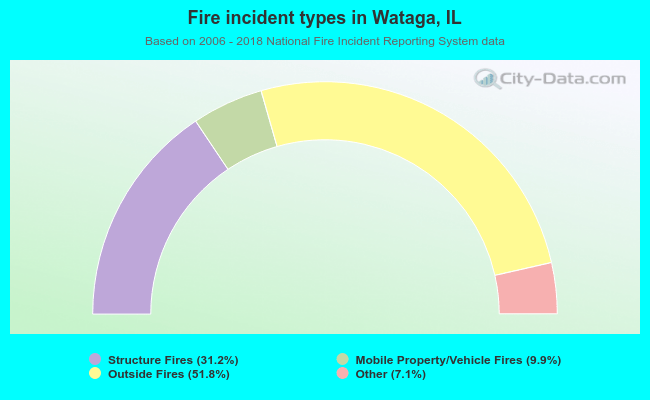 When looking into fire subcategories, the most reports belonged to: Outside Fires (51.8%), and Structure Fires (31.2%).