Washington Boro: Fire Incidents, Pennsylvania (PA)
Where are fire incidents reported in Washington Boro, PA
Something went wrong! Please refresh the page.
|
| |||||||||||||||||||||||||||||||||||||||||||||||||||||||||||||||||||||||||||||||||||||||||||||||||||||||||||||
2002 - 2018 National Fire Incident Reporting System (NFIRS) incidents
- Incident types reported to NFIRS in Washington Boro, PA
- 27548.5%Fire
- 10819.0%Hazardous Condition
- 8114.3%Rescue & EMS
- 468.1%Service Call
- 305.3%Good Intent Call
- 213.7%False Alarm
- 50.9%Severe Weather
- 10.2%Special Incident
- Fire incident types reported to NFIRS in Washington Boro, PA
- 12545.5%Structure Fires
- 9333.8%Outside Fires
- 4416.0%Mobile Property/Vehicle Fires
- 134.7%Other
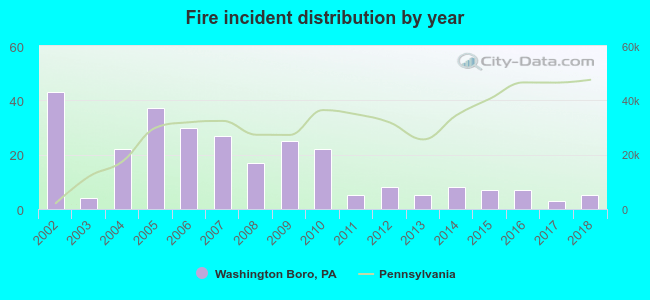 According to the data from the years 2002 - 2018 the average number of fires per year is 16. The highest number of fire incidents - 43 took place in 2002, and the least - 3 in 2017. The data has a declining trend.
 37.5% incidents where reported in the morning and 62.5% in the evening. The most fires (20.4%) took place on Saturday, and the least (9.1%) on Wednesday.
 According to the 275 reports from years 2002 - 2018 most fires (12.7%) took place during October, and the least (5.1%) in April.
 Out of all 567 cases reported during the years 2002 - 2018, the most belonged to the categories: Fire (48.5%), Rescue & EMS (19.0%), and Overpressure Rupture (14.3%).
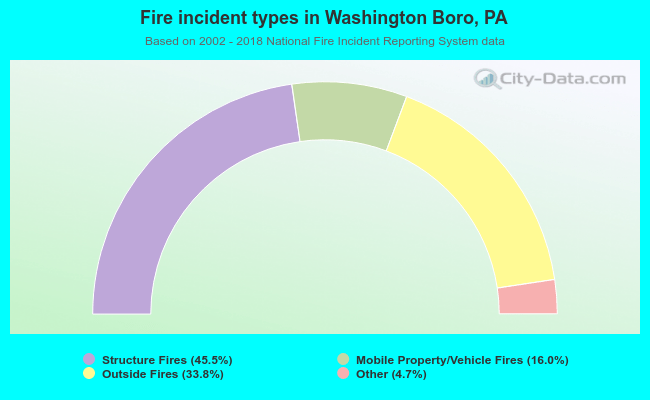 When looking into fire subcategories, the most incidents belonged to: Structure Fires (45.5%), and Outside Fires (33.8%).