Wartburg: Fire Incidents, Tennessee (TN)
Where are fire incidents reported in Wartburg, TN
Something went wrong! Please refresh the page.
|
| |||||||||||||||||||||||||||||||||||||||||||||||||||||||||||||||||||||||||||||||||||||||||||||||||||||||||||||
2003 - 2018 National Fire Incident Reporting System (NFIRS) incidents
- Incident types reported to NFIRS in Wartburg, TN
- 43143.0%Fire
- 24624.6%Rescue & EMS
- 19319.3%Hazardous Condition
- 505.0%Good Intent Call
- 404.0%False Alarm
- 272.7%Service Call
- 70.7%Special Incident
- 60.6%Severe Weather
- 20.2%Overpressure Rupture
- Fire incident types reported to NFIRS in Wartburg, TN
- 21750.3%Structure Fires
- 13832.0%Outside Fires
- 5212.1%Mobile Property/Vehicle Fires
- 245.6%Other
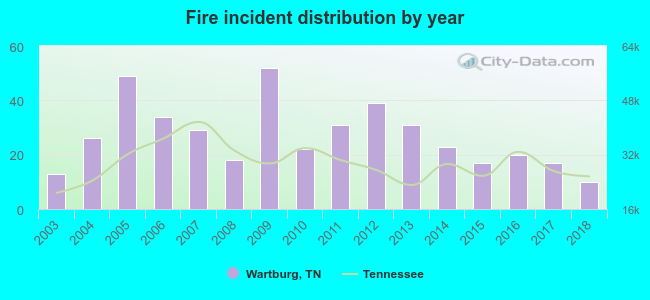 According to the data from the years 2003 - 2018 the average number of fires per year is 27. The highest number of fire incidents - 52 took place in 2009, and the least - 10 in 2018. The data has a declining trend.
 According to the data from the years 2003 - 2018 the average number of fire-related yearly deaths is 0. The highest number of reported deaths - 1 took place in 2005, and the lowest - 0 in 2003. The data has a constant trend.
 32.7% incidents where reported in the morning and 67.3% in the evening. The most fires (17.4%) took place on Sunday, and the least (10.9%) on Tuesday.
 According to the 431 fire incident reports from years 2003 - 2018 most fires (13.7%) took place during March, and the least (3.5%) in September.
 Out of all 1,002 cases reported during the years 2003 - 2018, the most belonged to the categories: Fire (43.0%), Rescue & EMS (24.6%), and Hazardous Condition (19.3%).
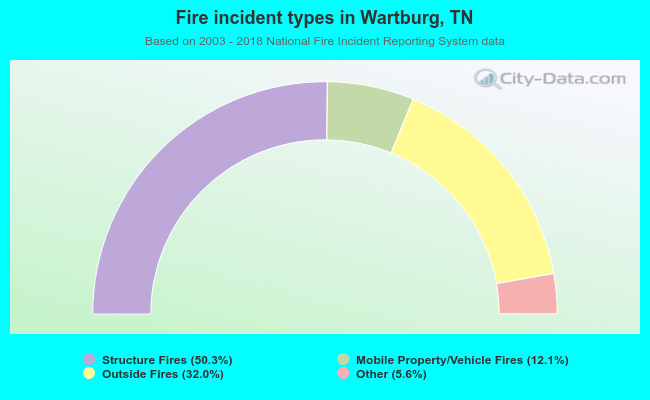 When looking into fire subcategories, the most reports belonged to: Structure Fires (50.3%), and Outside Fires (32.0%).