Warrenton: Fire Incidents, Oregon (OR)
Where are fire incidents reported in Warrenton, OR
Something went wrong! Please refresh the page.
|
| |||||||||||||||||||||||||||||||||||||||||||||||||||||||||||||||||||||||||||||||||||||||||||||||||||||||||||||
2002 - 2018 National Fire Incident Reporting System (NFIRS) incidents
- Incident types reported to NFIRS in Warrenton, OR
- 29840.9%Fire
- 27838.1%Rescue & EMS
- 8611.8%Hazardous Condition
- 283.8%Good Intent Call
- 253.4%Service Call
- 101.4%False Alarm
- 30.4%Severe Weather
- 10.1%Special Incident
- Fire incident types reported to NFIRS in Warrenton, OR
- 18060.4%Structure Fires
- 7926.5%Outside Fires
- 3311.1%Mobile Property/Vehicle Fires
- 62.0%Other
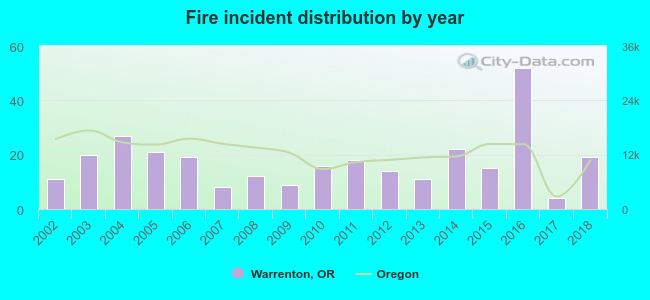 Based on the data from the years 2002 - 2018 the average number of fire incidents per year is 18. The highest number of reported fire incidents - 52 took place in 2016, and the least - 4 in 2017. The data has a rising trend.
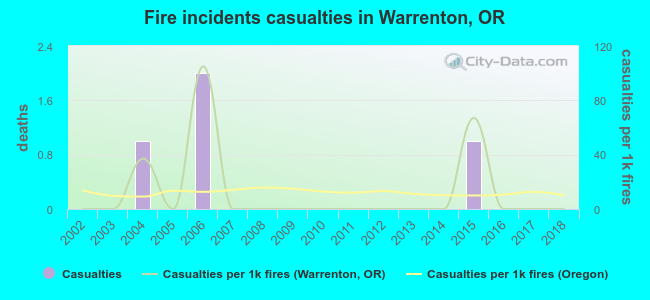 According to the data from the years 2002 - 2018 the average number of fire-related yearly casualties is 0. The highest number of casualties - 2 took place in 2006, and the lowest - 0 in 2002. The data has a constant trend.
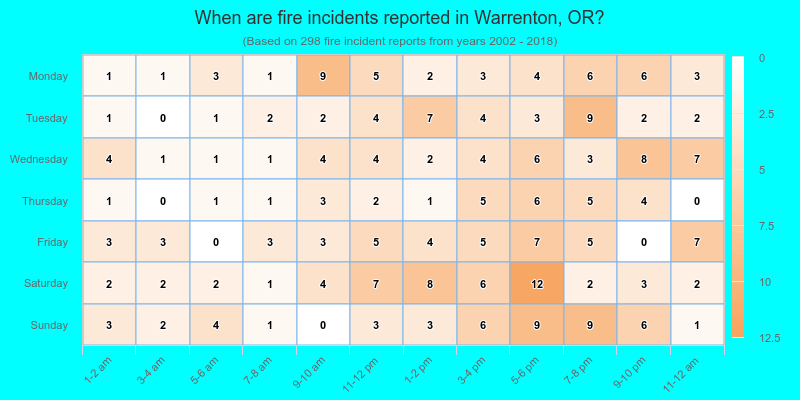
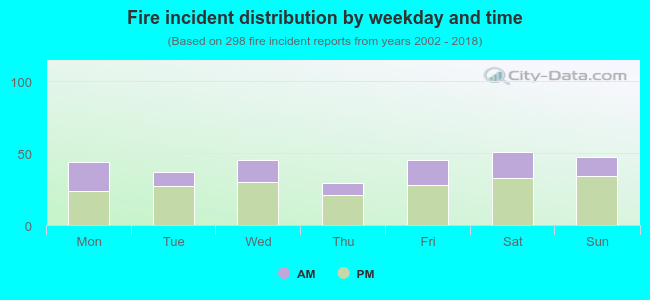 33.9% incidents where reported in the morning and 66.1% in the evening. The most fires (17.1%) took place on Saturday, and the least (9.7%) on Thursday.
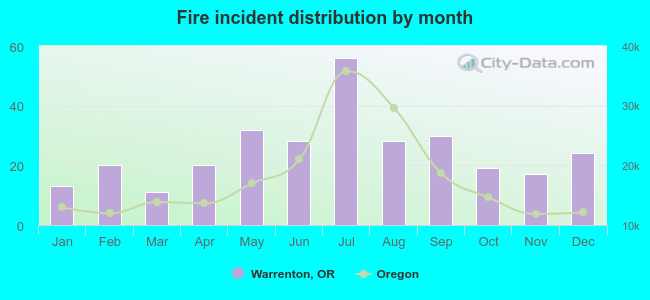 Based on the 298 fire incidents from years 2002 - 2018 most fires (18.8%) took place during July, and the least (3.7%) in March.
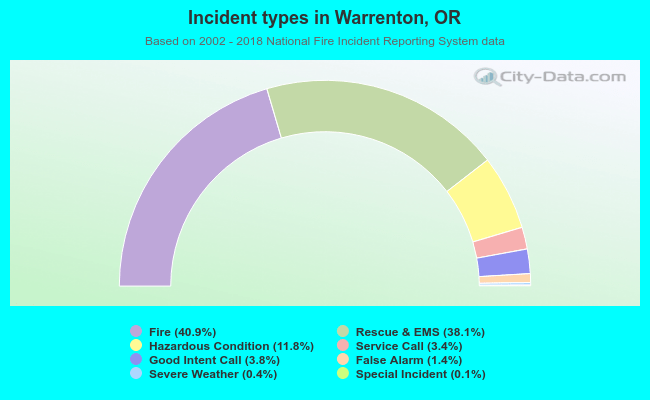 Out of all 729 cases reported during the years 2002 - 2018, the most belonged to the categories: Fire (40.9%), Overpressure Rupture (38.1%), and Rescue & EMS (11.8%).
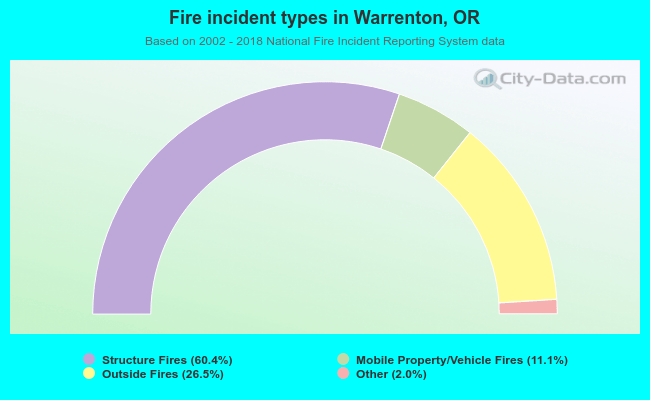 When looking into fire subcategories, the most incidents belonged to: Structure Fires (60.4%), and Outside Fires (26.5%).